
Demo Day Deck Analytics: Turn Views Into Follow-Ups
Unlock powerful insights with demo day deck analytics to boost engagement and follow-ups. Transform your pitch strategy today!
August 20, 2026 · 10 min read

Demo day deck analytics are slide-by-slide engagement signals, unique viewers, time per slide, drop-off points, and revisits, that show which parts of your pitch actually hold an investor’s attention. The one action to take before your next demo day: instrument the deck and turn on first-read alerts, so you know the moment someone opens it, not days later.
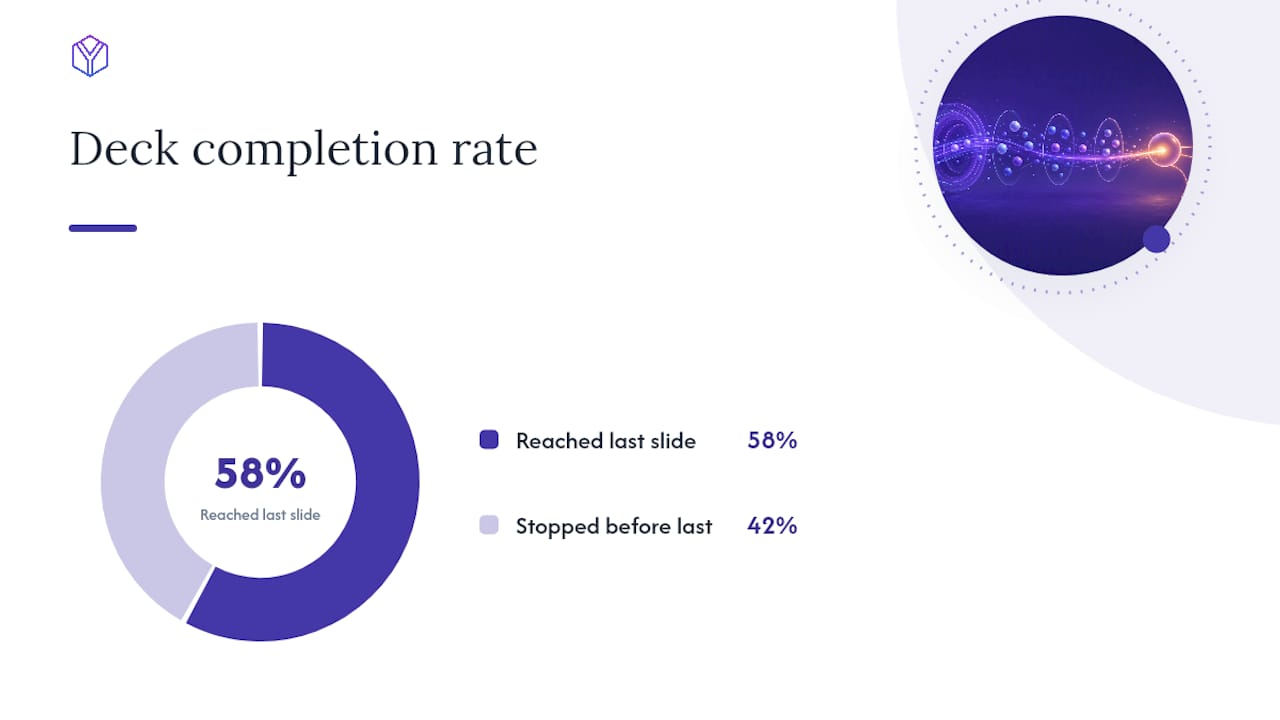
- Average seed-deck review time runs close to 3 minutes 44 seconds, with only about 58% of viewers reaching the last slide.
- Techstars advises treating the deck as a vessel for the story, not the story itself.
- Platforms like BabyLoveRaise now build first-read notifications and per-slide dwell tracking directly into the raise room.
Pro Tip: Set up your tracking link a full day before demo day and open it yourself from a different device. If the timestamp and slide data don’t show up, your investors won’t show up in your dashboard either.
Key Takeaways
Demo day deck analytics work because per-slide dwell and revisit patterns reveal investor intent that open rates alone can never show.
| Point | Details |
|---|---|
| Track dwell, not just opens | Time per slide and revisit frequency signal real interest better than a simple open count. |
| Benchmark against known averages | Seed decks average close to 3 minutes 44 seconds reviewed, with about 58% reaching the last slide. |
| Keep the live deck lean | Cap the core presentation at 11 to 14 slides and push dense proof into an appendix. |
| Match outreach to behavior | Segment viewers into no-opener, skimmer, deep reader, and re-checker, then message each differently. |
| Use a purpose-built raise room | BabyLoveRaise combines first-read alerts, per-slide analytics, and CRM export in one founder-facing dashboard. |
Table of Contents
- Why Slide-By-Slide Demo Day Deck Analytics Change How You Pitch
- Which Metrics Should You Actually Track?
- What to Do With the Data, Before, During, and After
- How Do You Set Up Deck Analytics for Demo Day?
- How Do You Interpret and Act on the Signals?
- What Are the Privacy Limits of Deck Tracking?
- How Does a Raise Room Like BabyLoveRaise Handle This?
- A Fundraising Operator’s Take
- Try a Raise Room for Your Next Demo Day
- Frequently Asked Questions
- Sources
Why Slide-By-Slide Demo Day Deck Analytics Change How You Pitch
Open rates tell you who clicked a link. They tell you nothing about whether investors read your traction slide twice or bailed at slide four. Per-slide analytics expose exactly where attention dies, turning a vague “did they like it?” into a specific, fixable diagnosis: this slide, this second.
The deck is a vessel for the story, not the story itself. Write the narrative first, keep the live version spare, and push dense proof into an appendix where curious readers can dig.
That framing from Techstars matters because it reframes what analytics are for. You’re not measuring performance metrics for their own sake. You’re stress-testing a story.
Three things change once you have this data:
- Live pitches get tighter, because you cut the slides nobody lingers on.
- Follow-ups get targeted, because you know who actually read the traction numbers.
- Your narrative improves faster, because repeated drop-off at the same slide points to a structural pitch deck performance problem, not a design tweak.
Which Metrics Should You Actually Track?
Not every number deserves your attention on demo day. Here’s what matters and what to do with it:
- Unique viewers: How many distinct people opened the deck. Low count after a big send means your list or subject line, not your slides, is the problem.
- Total opens: Repeat opens from the same viewer often mean internal forwarding or a second look before a partner meeting.
- Average session time: A quick proxy for interest. Seed decks average under four minutes; much shorter usually means a pass.
- Time per slide (dwell): The highest-priority signal on demo day. Long dwell on your market or traction slide often means someone paused to think, or pulled in a partner.
- Slide completion rate: Only about 58% of viewers reach the final slide industry-wide. If yours is lower, your middle slides are losing people.
- Drop-off slide: The exact slide where sessions end. This is your single best editing signal.
- Revisit frequency: Multiple short return visits often signal internal discussion inside the fund, a stronger tell than one long read, according to Visible.
- First and last viewed timestamps: Tells you exactly when to strike with a follow-up, while the deck is still open in their mind.
What to Do With the Data, Before, During, and After
Analytics only pay off if you act on a schedule, not after the fact.
- Before demo day. Install tracking on the exact link you’ll send, test first-read alerts on a dummy account, and trim your live core to 11 to 14 slides. AI drafting tools can speed up the build, but they routinely churn out 15 to 20-slide decks with placeholder financials that need real numbers swapped in before anyone sees them.
- During demo day. Watch live alerts as they fire. A first-read notification thirty minutes after your pitch is a warmer lead than one from three days later; move on it the same day.
- After demo day. Segment every investor into one of four buckets: no-opener, skimmer, deep reader, re-checker. Each bucket gets a different message, not the same generic “thanks for your time” blast.
Pro Tip: Triage by recency, not by fund size. A no-name angel who reopened your deck twice this morning is a better use of your next hour than a well-known fund that opened it once, five days ago, for eleven seconds.
How Do You Set Up Deck Analytics for Demo Day?
Run through this before you send a single link:
- Host the deck as a trackable web version rather than a flat PDF attachment, so per-slide data can actually capture.
- Turn on email capture or tokenized links so every open ties back to a specific viewer, not an anonymous IP.
- Enable first-read notifications and full session logging, not just a daily summary email.
- Set drop-off and completion tracking live, so you catch a structural problem after your first few sends, not after fifty.
- Move dense data, cohort tables, detailed unit economics, competitor grids, into an appendix rather than the live core.
- Connect the tool’s export or API to wherever you’re tracking your pipeline, so engagement data doesn’t sit stranded in a separate dashboard.
Test it before it matters. Open the link from your phone and your laptop, check that both sessions log separately, confirm time-per-slide numbers look right against a stopwatch, and verify your CRM export actually pulls data instead of an empty file.
Pro Tip: Rehearse with the identical link you’ll send to investors, not a local file. Instrumentation that works on your test copy but not your live-shared link is a common, avoidable failure.
How Do You Interpret and Act on the Signals?
Behavior patterns map cleanly to next steps, once you stop treating every open the same way.
- No open after 48 hours: Resend with a shorter subject line, or ask a warm connector to nudge.
- Quick skim under 90 seconds: Send a one-line follow-up highlighting the single slide most investors linger on.
- Long dwell on one specific slide: Address that slide directly. If it’s traction, send the underlying numbers. If it’s the team slide, offer a call.
- Repeated revisits over several days: Treat this as active internal discussion and prioritize a call request immediately.
Sample outreach lines, matched to behavior:
- Long dwell on traction: “Noticed you spent time on our growth numbers, happy to walk through the cohort data behind them.”
- Multiple revisits: “Saw you’ve come back to the deck a few times, want to grab 20 minutes this week?”
- Skimmed and stopped: “Quick version if useful: here’s the one-paragraph thesis, happy to send the full follow-up plan if it’s a fit.”
- No open, second attempt: “Following up in case this landed in a busy week, keeping the ask short.”
Don’t overreact to a single 20-second visit; that could be a phone-check between meetings, not a pass. Weigh analytics against what was actually said in the room.
What Are the Privacy Limits of Deck Tracking?
Analytics are proxies, not proof. Time spent on a slide doesn’t confirm approval, and a fast scroll doesn’t confirm rejection.
- Dwell time measures attention, not agreement.
- Some investors actively avoid tracked links out of habit or principle.
- Capture only the minimal contact detail needed, and keep an untracked download option available for anyone who asks.
Track the document, never the person. A raise room should report on what happened to the deck, not build a surveillance profile of the investor reading it.
Never scrape contact lists or misrepresent who’s sending the link. When in doubt, favor the relationship over the data point.
How Does a Raise Room Like BabyLoveRaise Handle This?
A raise room built specifically for fundraising bundles the whole playbook above into one link instead of five disconnected tools.
- Per-slide dwell and full session timelines, so you see exactly where a specific investor spent their time.
- First-read notifications the moment someone opens your deck, live.
- Viewer identification tied to first and last viewed timestamps.
- CRM export so engagement data flows into your existing pipeline tracker.
- Appendix hosting for dense material you don’t want cluttering the live 11 to 14-slide core.
- An Operator console for fractional CFOs and advisory firms running several client raises under one branded dashboard.
Say a fund revisits your traction slide three times in two days. That’s your cue to call, not email. An advisory firm running four client raises can watch all four dashboards from one operator view instead of logging into four separate tools.
Pro Tip: If you don’t have a technical cofounder to sanity-check your numbers, per-slide dwell data is the closest thing to a second set of eyes on which claims actually land.
A Fundraising Operator’s Take
The biggest shift isn’t the dashboard, it’s the follow-up cadence. Once you can see a revisit on the traction slide in real time, “let me circle back next week” turns into a same-day call request, and that speed alone has moved conversations that would otherwise have gone cold. Founders who treat deck analytics as a triage tool, not a vanity metric, close their loop faster.
Try a Raise Room for Your Next Demo Day
BabyLoveRaise replaces the blind PDF send with a raise room that tells you the moment someone reads it, not the moment they reply, or never do. Instead of guessing why a fund went quiet, you’ll see first-read alerts, per-slide dwell, and full session timelines the instant they happen, then export that behavior straight into your CRM for follow-up.
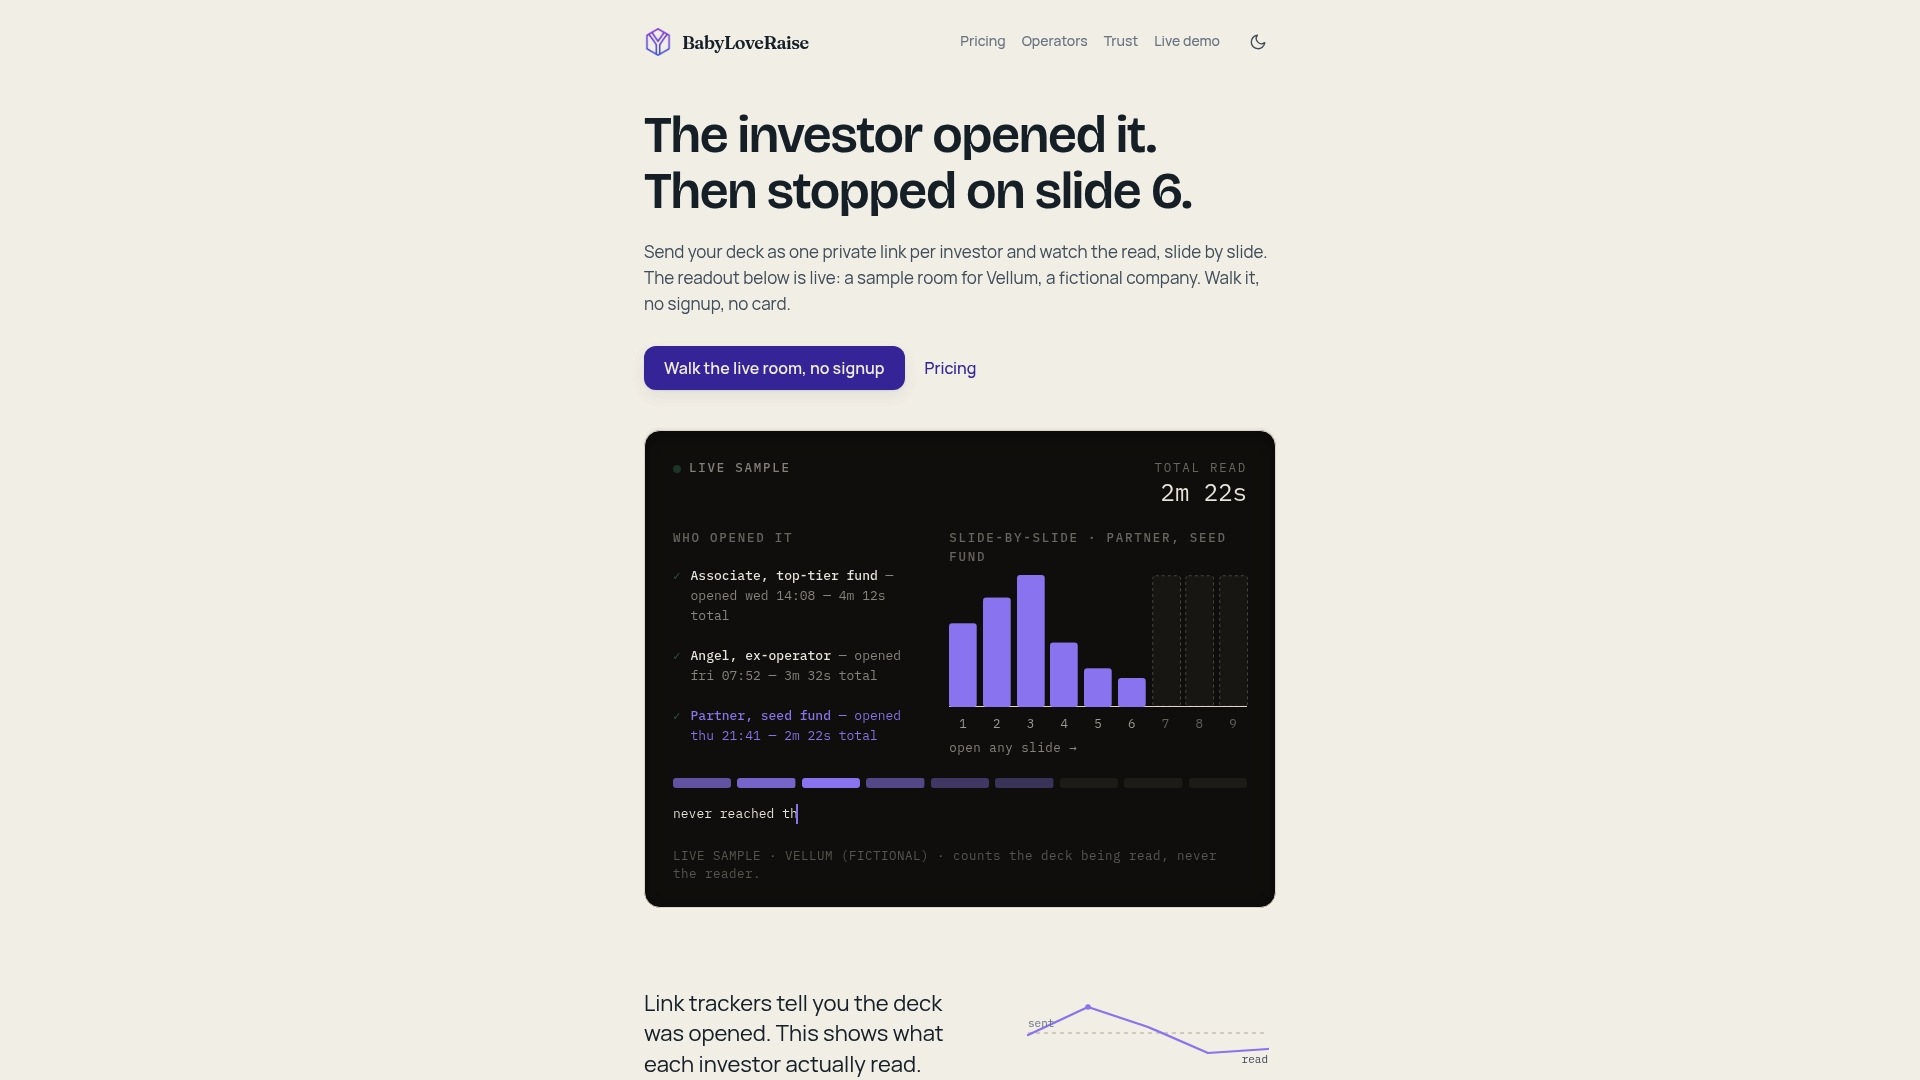
If you’re prepping for a demo day, the pricing page breaks down the founder plan against the Operator tier for advisory firms running multiple client raises, plus the optional concierge editorial pass if you want a second set of eyes on the narrative itself. Check the trust and platform overview for how share links, watermarking, and archive conversion work once your raise closes. Set up your room before your next send goes out.
Frequently Asked Questions
What is a good completion rate for a demo day deck? Aim above the roughly 58% industry average reported for seed decks. Below that, suspect a structural problem around your middle slides.
How many slides should a live demo day deck have? Most fundraising guidance points to a core of 11 to 14 slides, with dense financials, cohort tables, and competitive grids pushed into an appendix rather than shown live.
Can investors tell if I’m tracking their views? Most raise-room tools use standard tracked links, similar to email open tracking. Offer an untracked download option for privacy-sensitive recipients to keep the relationship comfortable.
What’s the single most important metric to check first after a send? Drop-off slide. It tells you exactly where the story loses people, faster than any open-rate summary ever will.
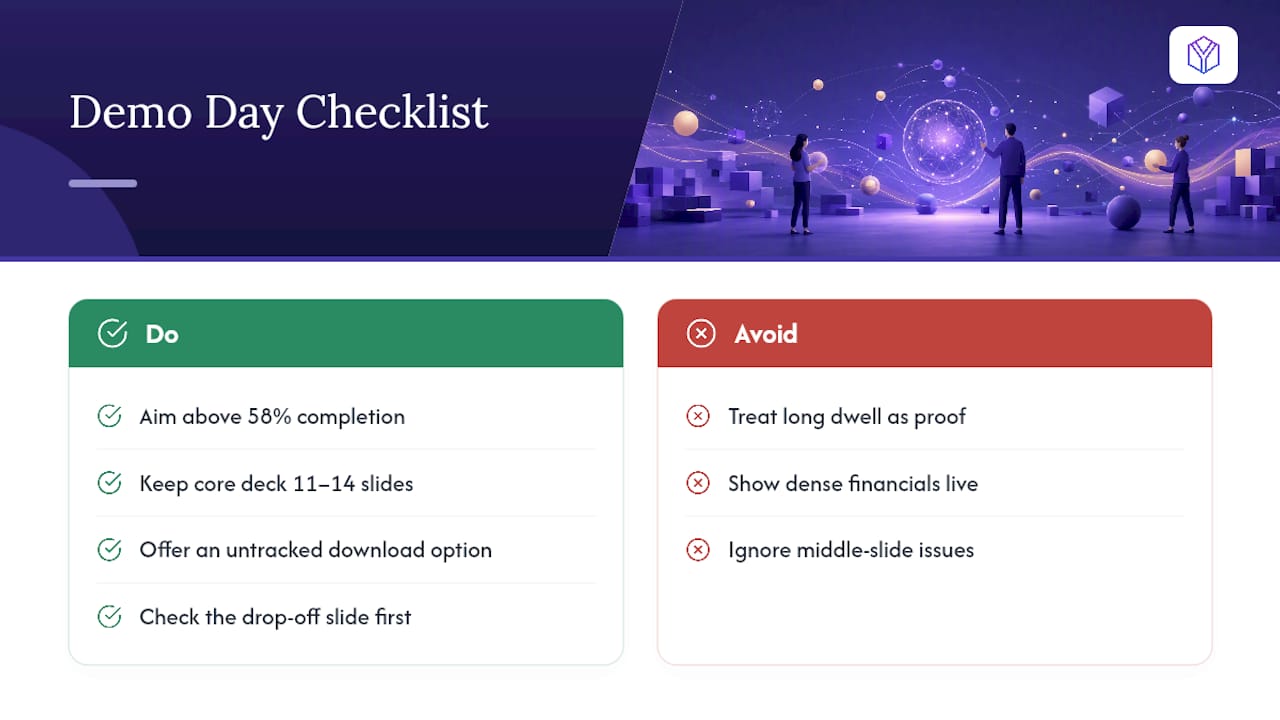
Does a long dwell time always mean interest? Not always. It’s a proxy, not proof. Combine it with what was actually discussed in a meeting before deciding how hard to push a follow-up.
Sources
- Why Most Pitch Decks Don’t Work, and How to Make Sure Yours Does | Techstars
- AI Investor Pitch Deck 2026: 11-Slide Structure VCs Expect | Slide Gamma AI
- Pitch Deck Statistics Every Founder Should Know in 2026