
Pitch Deck Analytics for Founders: Improve Investor Engagement
Transform your fundraising strategy with pitch deck analytics. Uncover key metrics, enhance investor engagement, and boost your raise success.
August 2, 2026 · 14 min read

Use fundraising-focused pitch deck analytics to surface 3–6 investor-grade metrics and per-slide engagement data, then act on what you find within 48 hours. The fastest path to a better raise: share a gated link, watch who opens it and how far they read, fix the slides where attention dies, and follow up with investors based on actual behavior. BabyLoveRaise is the recommended raise-focused platform for this workflow, priced per raise rather than per seat.
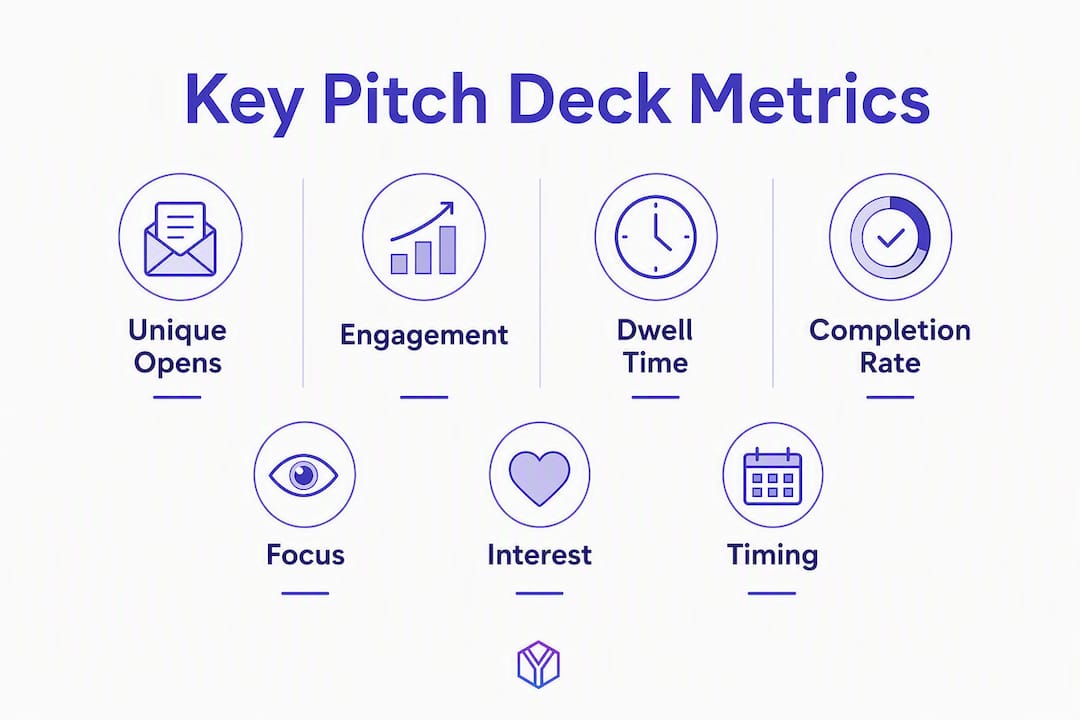
What to capture: unique opens, per-slide dwell time, completion rate, and first-read timestamp.

Immediate next step: send a gated link and monitor the first 48-hour behavior window.

Why BabyLoveRaise: first-read notification, per-slide heatmaps, respectful document-level tracking, and pricing that ends when the raise does.
Table of Contents
- What does pitch deck analytics actually measure?
- Which metrics should your deck actually show investors?
- How do you read per-slide engagement and act on it?
- What should you look for in a deck tracking tool?
- Examples of analytics-informed deck changes
- Privacy and investor etiquette when tracking decks
- How BabyLoveRaise is built for raises
- What does pitch deck analytics cost, and how fast can you act?
- Key Takeaways
- The part most founders skip
- Your raise room is ready when you are
- Useful sources
What does pitch deck analytics actually measure?
Pitch deck analytics captures discrete events at two levels: the document and the individual slide. Knowing which level a metric lives on determines how you act on it.
Document-level metrics tell you about the viewing session as a whole:
- Unique opens: each distinct viewer session, identified by email gate or link token
- First-read timestamp: the exact moment an investor first opened the deck, useful for timing follow-ups
- Completion rate: the share of viewers who reached the final slide
- Forward/reshare indicators: when a link is passed to a colleague or partner (available when link-level tracking is enabled)
Slide-level metrics tell you what happened inside the deck:
- Per-slide dwell time: seconds spent on each slide, the closest proxy for attention
- Attention heatmaps: visual overlays showing which areas of a slide drew the most focus
- Slide revisit counts: how many times a viewer returned to a specific slide, often a signal of genuine interest or confusion
- Link clicks inside the deck: CTA taps, model links, or data-room links embedded in slides
Link-level tracking sits one layer above both: each share link carries its own analytics, so you can compare how a warm intro link performed versus a cold outreach link, or track whether a forwarded link generated new sessions.
The gap that matters most is between “never opened” and “read every slide and passed.” Both look like silence in your inbox. Per-slide engagement data separates them.
Which metrics should your deck actually show investors?
Investors in 2026 expect a specific set of metrics that demonstrate business health, growth trajectory, and unit economics. Dumping every number you track into a metrics slide is one of the most common mistakes founders make. The goal is a concise set that answers three questions: is there demand, are the unit economics sound, and is the capital being used efficiently?
| Metric | What it demonstrates | Simplest visual |
|---|---|---|
| ARR/MRR with growth rate | Revenue scale and velocity | 6-month bar or line chart |
| Net Revenue Retention (NRR) | Expansion from existing customers | Single percentage with prior period |
| Gross margin | Business model quality | Percentage with industry benchmark |
| LTV:CAC ratio | Unit economics health | Simple ratio (e.g., 4:1) |
| CAC payback period | Capital efficiency | Months to payback |
| Burn multiple | Cash efficiency | Net burn ÷ net new ARR |
Lead with your single strongest metric and show at least six months of trend data where possible. A number without a trend is a claim; a trend is evidence. Footnote your cohort definitions and the reporting cut-off date so investors can’t poke holes in your methodology.
Stage matters too. A pre-seed deck can lean on MoM growth rate and early PMF signals. A Series A deck needs ARR, LTV:CAC, burn multiple, NRR, and gross margin together. Showing Series B metrics at pre-seed reads as noise; missing Series A metrics at Series A reads as a red flag.
Pro Tip: Avoid data-dumping by limiting your metrics slide to 6–8 high-impact figures. Every metric you add beyond that dilutes the ones that matter. If a number doesn’t directly answer “is this a good investment?”, move it to an appendix.
How do you read per-slide engagement and act on it?
Per-slide dwell data is only useful if you have a process for turning it into edits and outreach decisions. Here is a practical checklist.
Diagnosing slide leaks
- Identify the drop-off point. Find the slide where average dwell time falls sharply or where completion rate drops. That slide is your leak.
- Check slide complexity. High text density, small fonts, or multi-part tables all reduce dwell. If the slide requires more than 10 seconds to parse, simplify it.
- Look for missing context. A slide that assumes prior knowledge the investor doesn’t have will lose them. Add a one-line setup sentence.
- Check the ask placement. If your ask slide comes after the slide where attention dies, most investors never see it. Move it earlier.
- Review the first slide. Low dwell on slide one usually means the opening frame isn’t compelling. A founder intro video or a single bold problem statement can recover this.
Concrete edits based on what you see
- Financials slide losing attention: reduce table density, pull the headline metric into a large-format callout, and move supporting detail to an appendix.
- Traction slide skimmed: replace a data table with a single trend chart and one sentence of context.
- Team slide over-indexed: trim bios to two lines each; investors read logos and titles, not paragraphs.
- Re-opened slides: a slide revisited multiple times signals genuine interest or a question. Address it proactively in your follow-up.
Segmented follow-up based on behavior
Finished the deck (high completion rate): Follow up within 24 hours. Reference the deck directly: “Saw you made it through the full deck — happy to answer questions or set up 20 minutes.” These investors are warm.
Opened but stopped mid-deck: Wait 48 hours, then send a short note with a specific hook tied to the slide they likely stopped on. “Wanted to flag our NRR number in case the traction slide was hard to read on mobile.”
Never opened: Don’t follow up as if they read it. Resend with a different subject line or a different link register. Aligning your deck narrative with the follow-up message keeps the conversation coherent.
Pro Tip: Early signals, particularly behavior in the first 48–72 hours after a send, are the most predictive of whether an investor will take a meeting. Prioritize that window for outreach.
What should you look for in a deck tracking tool?
Not every document-tracking tool is built for fundraising. General file-share analytics treat a pitch deck like any other PDF. A fundraising-specific tool is built around the raise itself.
Feature checklist for a fundraising-ready tool:
- Per-slide dwell heatmaps (not just total time on deck)
- First-read notification with exact timestamp
- Unique viewer identification via email gate or link token
- Gated access with email capture before the deck opens
- Link click tracking for embedded CTAs or data-room links
- CRM integrations (Zapier, HubSpot) that push view events automatically
- PDF fidelity and clean mobile rendering
- AI-driven slide feedback tuned for investor signals (structure, missing metrics, text density)
- Download controls with optional watermarking
Pricing model comparison:
- Per-raise pricing: you pay for one raise, the room closes when you close. Best for single-raise founders who don’t want a recurring subscription.
- Per-seat subscription: monthly or annual fee per user. Works for teams running multiple raises simultaneously but adds ongoing cost after the raise ends.
- VDR-style pricing: full virtual data room with due-diligence folders, user permissions, and audit logs. Priced accordingly, often $300–$500/month or more. Overkill for most pre-seed and seed raises.
- White-label Operator tier: a console that lets advisors or fractional CFOs run branded rooms across multiple client raises. Fraction of VDR pricing, purpose-built for advisory firms.
Pro Tip: For a single raise, per-raise pricing almost always wins on cost and simplicity. If you’re a fractional CFO or advisor running three or more client raises a year, an Operator tier pays for itself quickly. Compare the data-room alternatives before committing to a VDR contract.
Examples of analytics-informed deck changes
Case 1: The financials slide nobody finished
A seed-stage founder shared a deck with a dense financials slide: a five-column table with quarterly projections, unit economics, and a burn schedule all on one page. Analytics showed average dwell of under four seconds on that slide and a 40% drop in completion rate immediately after it.
The fix: one large-format ARR trend chart, a single burn multiple callout, and the full table moved to an appendix. After the edit, completion rate on that send recovered significantly, and three investors who had previously gone silent responded within 48 hours of the revised deck going out.
Case 2: The team slide that buried the ask
A pre-seed founder’s analytics showed high dwell on the team slide (investors were reading every bio) but near-zero engagement on the ask slide that followed. The ask was on slide 14 of 15. Moving the ask to slide 10, right after traction, and trimming the team slide to logos and two-line bios produced a measurable lift in investors reaching the ask slide.
Case 3: A/B testing an edited slide
Once you have enough sessions (roughly 10 or more per variant), you can run a simple A/B: share the original deck via one link and the edited version via a second link, both tracked separately. Measure completion rate and per-slide dwell on the changed slide. If the edited version shows higher dwell and lower drop-off, the change is working. Keep the test clean: change one slide at a time, and give each variant at least a week before drawing conclusions.
What the data actually tells you: a drop in dwell on a specific slide is not a verdict on your business. It is a signal about communication. Fix the communication, then let the metrics speak.
Privacy and investor etiquette when tracking decks
Tracking investor engagement is standard practice. Doing it in a way that feels invasive is not. The line is between document-level analytics (what the deck did) and personal surveillance (what the person did beyond reading).
Do:
- Use email-gated access so viewers know they are identified when they open the deck
- Track view events, per-slide dwell, and completion at the document level
- Reference engagement in follow-ups naturally: “Saw you had a chance to look at the deck — happy to answer any questions”
- Use privacy-first tracking that reports on the document, not the person
Don’t:
- Track location data, device fingerprints, or behavioral data beyond view events without explicit consent
- Send follow-ups that reveal surveillance-level detail (“I saw you spent 47 seconds on slide 8 at 11:43 PM”)
- Use tracking as a pressure tactic rather than a signal for genuine follow-up
The practical rule: if your follow-up message would make an investor uncomfortable if they knew exactly how you knew it, reframe it. “Saw you opened the deck” is fine. Quoting exact timestamps and slide-by-slide behavior in a cold follow-up is not.
Note: this guide covers general best practices, not legal advice. If you collect identifying data from investors, review your privacy disclosures with a qualified professional.
How BabyLoveRaise is built for raises
BabyLoveRaise is designed around one workflow: a founder shares a raise room link, an investor opens it through a gated access page, and the founder gets a first-read notification the moment it happens. From there, per-slide dwell heatmaps build in real time, AI flags surface structure issues (too much text, missing headline metric, weak ask placement), and the owner dashboard separates investors who finished from those who skimmed or never opened.
Core features tied to fundraising needs:
- First-read notification with exact timestamp
- Per-slide dwell heatmaps across every viewer session
- Email-gated raise rooms with three link registers (first send, forwardable, private)
- Per-raise pricing with no ongoing subscription after the raise closes
- White-label Operator tier for fractional CFOs and advisory firms running multiple client raises
- Optional concierge editorial passes and narrative Build Map artifacts for founders who want hands-on help
- CRM integrations via Zapier for pushing view events to HubSpot or your pipeline tool
The AI feedback layer surfaces diagnostic signals: slides with excessive text density, missing headline metrics, or structural gaps that investors commonly flag. It is a starting point for founder review, not a replacement for it. Final edits should always be tied to the narrative you are building, not just the flags the AI surfaces.
When the raise closes, the room converts to a free permanent archive. No paywall cliff, no data loss.
[Author bio and testimonials placeholder — insert case studies and internal efficacy data here.]
What does pitch deck analytics cost, and how fast can you act?
| Pricing model | Best for | Typical cost shape | Setup to first data |
|---|---|---|---|
| Per-raise | Single-raise founders | Fixed fee for the raise period | Under 30 minutes |
| Per-seat subscription | Teams running multiple raises | Monthly/annual per user | Same day |
| VDR-style | Due diligence, not pitch sharing | $300–$500+/month | Hours to days |
| Operator/white-label | Advisors, fractional CFOs | Console fee across client raises | Same day |
Setup is fast. Upload your deck, configure gated access, and generate your first trackable link in under 30 minutes. Early signals arrive within the first 48–72 hours of a send, which is the window most predictive of investor interest. Trend validation, the kind that supports A/B-style slide edits, takes 1–2 weeks and roughly 10 or more sessions per variant.
For a single pre-seed or seed raise, per-raise pricing from BabyLoveRaise is almost always the right call. You get the full feature set for the duration of the raise, and the cost ends when the raise does. Advisors managing three or more client raises annually should look at the Operator tier.
Pro Tip: Prioritize three features above everything else: gated access (so you know who opened it), per-slide analytics (so you know where attention died), and a CRM push (so view events land in your pipeline automatically). Everything else is secondary.
Key Takeaways
Pitch deck analytics turns two identical silences, “never opened” and “read everything and passed,” into two different, actionable states that drive smarter follow-ups and better decks.
| Point | Details |
|---|---|
| Capture the right events | Track unique opens, per-slide dwell, completion rate, and first-read timestamp as your core four. |
| Lead with one strong metric | Surface your single best investor-grade metric prominently; add trend data for at least six months. |
| Fix slides that lose attention | When dwell drops sharply on a slide, reduce complexity, pull the headline metric forward, and move detail to an appendix. |
| Segment your follow-ups | Investors who finished the deck get a 24-hour follow-up; those who stopped mid-deck get a targeted hook tied to where they dropped off. |
| Use BabyLoveRaise for the raise | Per-raise pricing, first-read notifications, and per-slide heatmaps make it the purpose-built option for pre-seed and seed founders. |
The part most founders skip
Most founders treat pitch deck analytics as a vanity check: did anyone open it? That is the least useful question you can ask. The useful questions are where did attention die, who finished and hasn’t responded, and which slide is making investors hesitate.
The founders who close rounds faster are not the ones with the best decks on day one. They are the ones who treat the first two weeks of outreach as a data collection exercise, make one high-impact edit based on what they see, and follow up with the investors who actually read the deck rather than the ones who went quiet.
AI-driven feedback accelerates that loop. It surfaces the obvious structural problems fast. But the insight that actually changes a round, the realization that your financials slide is losing 40% of investors before they see your ask, comes from the engagement data, not the AI. Use both.
Your raise room is ready when you are
Sending a PDF and waiting is the old way. BabyLoveRaise gives you a raise room that notifies you the moment an investor opens your deck, shows you exactly which slides held their attention, and tells you who finished versus who skimmed. Per-raise pricing means you pay for the raise, not a subscription that outlasts it.
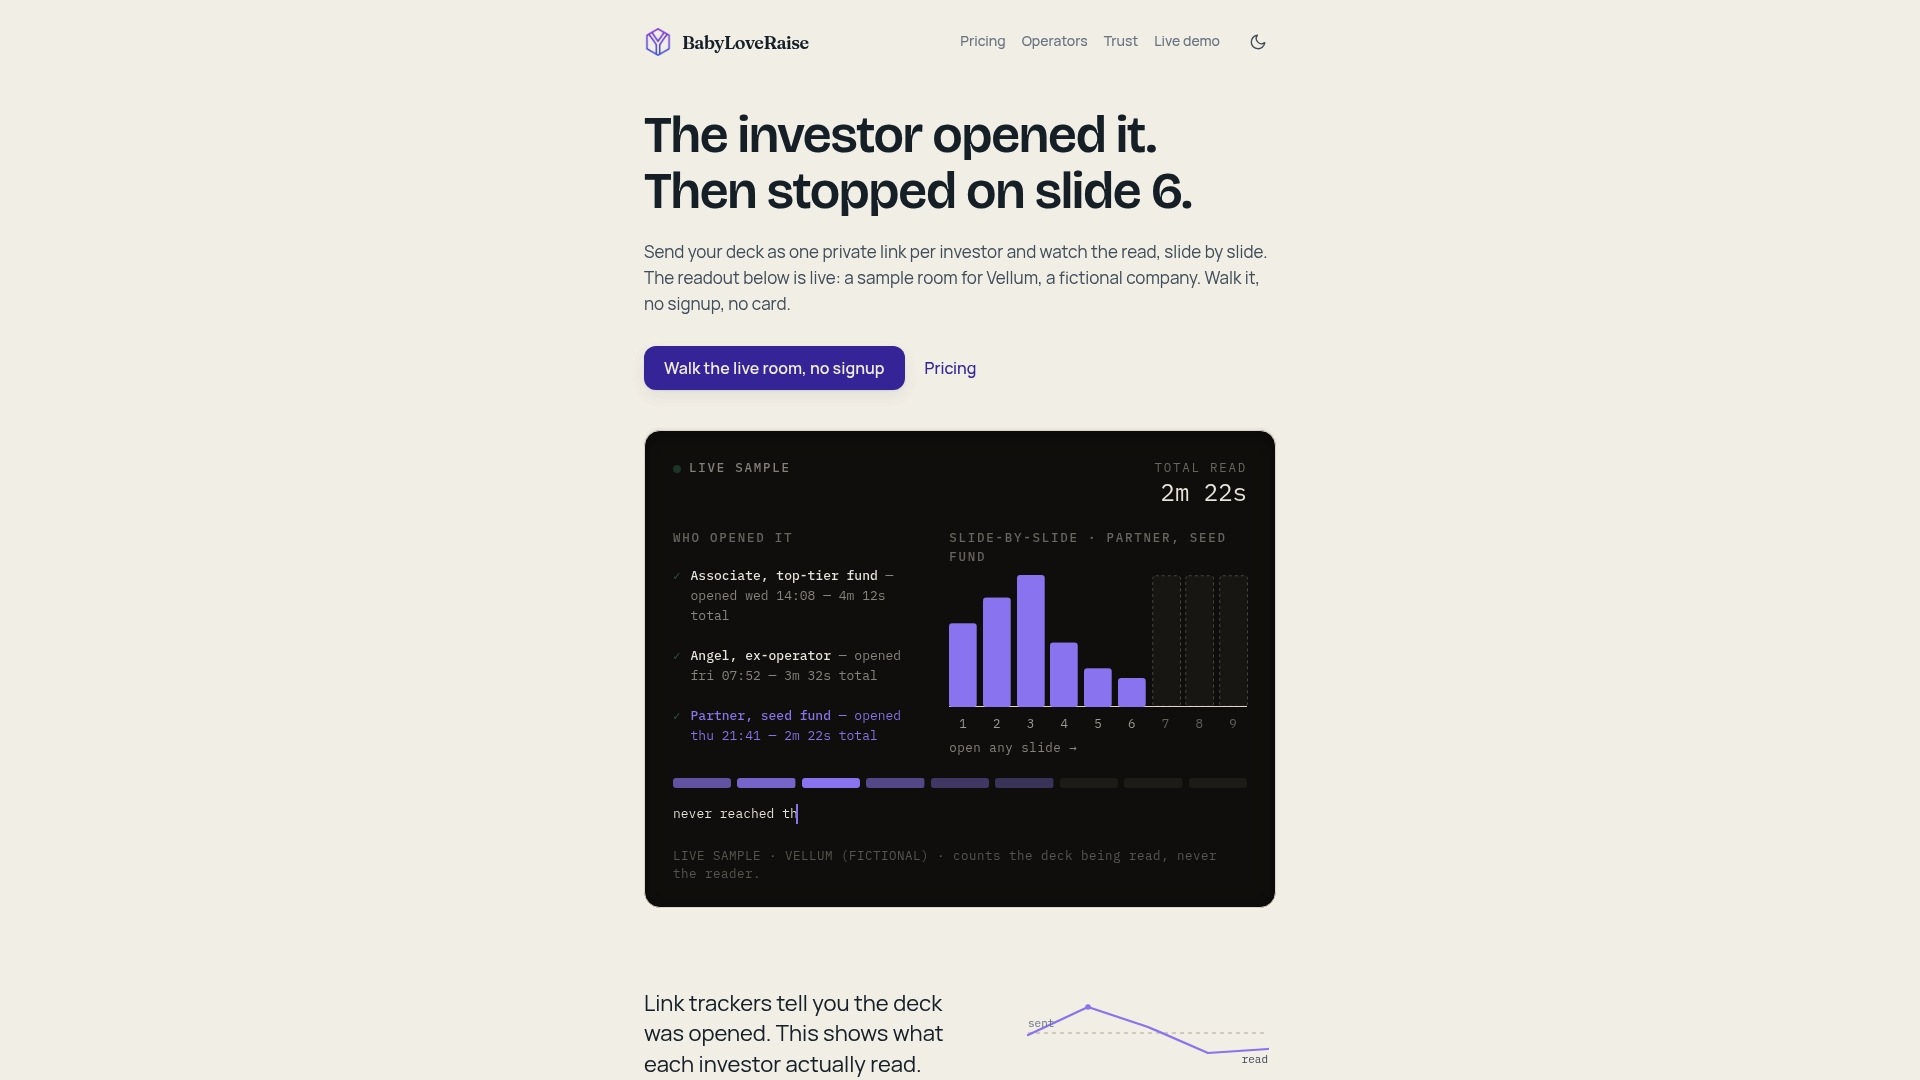
Three things founders get from day one: per-slide heatmaps that show where attention drops, first-read notifications so follow-ups land while the deck is fresh, and a clean Operator tier if you’re an advisor running multiple client raises. Optional editorial passes and narrative Build Map artifacts are available for founders who want hands-on help before the deck goes out.
See pricing and start your raise room or review the trust and privacy details before you share your first link.
Useful sources
- 10 Pitch Deck Metrics Investors Expect in 2026 — Stage-specific benchmarks for ARR, NRR, LTV:CAC, burn multiple, and Rule of 40; used for the metrics section.
- Pitch Deck Metrics: What Investors Want to See | Opagio — The 8 core metrics every funded deck includes, with LTV:CAC benchmarks and intangible asset context.
- The metrics slide that gets you funded — Structural guidance on leading with your best metric and using trend data; used for the metrics and slide-edit sections.
- How to Present Startup Metrics in a Pitch Deck — Guidance on replacing vanity metrics with revenue- and retention-focused measures.
- How to Prepare Pitch Metrics That Raise Capital | Affiniti Venture Studio — Operational guidance on definitions, reporting cut-off, and aligning deck, model, and narrative.
- Pitch deck tracking without turning investors into profiles | BabyLoveRaise — BabyLoveRaise’s privacy-first approach to document-level tracking and gated access.
- BabyLoveRaise pricing — Per-raise and Operator-tier pricing details.