
How to Refine Your Startup Presentation in 2026
Discover how to refine your startup presentation in 2026. Learn key tips to captivate investors and enhance your pitch deck's effectiveness.
July 30, 2026 · 11 min read

Fix the first three slides first. That’s where the raise lives or dies. Investors spend an average of 3 minutes and 44 seconds reading a pitch deck; if your cover, problem, and solution slides don’t pass the 20–30 second glance filter, roughly one-third of viewers never scroll further. Everything else, the traction, the financials, the team, only gets read if those first slides earn it.
Three fixes you can test in the next hour:
- Rewrite your cover slide headline to state the outcome you deliver, not your product category.
- Compress your problem slide to one sentence and one data point that makes the pain undeniable.
- Replace your solution slide’s feature list with a single quantified outcome the customer gets.
Pro Tip: Send the revised deck through a raise room with per-slide tracking enabled. If first-read time on slides 1–3 increases and drop-off falls, the fix worked. If dwell stays under two seconds per slide, the headline still isn’t landing.
Table of Contents
- What does each slide in your deck actually need to do?
- How do you use engagement analytics to prioritize edits?
- How should you follow up based on what investors actually did?
- How do you shift your deck from features to purpose?
- What does a realistic refinement timeline and budget look like?
- A 7-day testing plan you can run this week
- Key Takeaways
- What founders consistently get wrong about deck refinement
- BabyLoveRaise turns your raise room into a refinement engine
- Sources and further reading
What does each slide in your deck actually need to do?
A canonical pitch deck runs ten slides plus an appendix. Each one has a single job. Here’s what that job is, what kills it, and what to cut.
Cover: State the company name, a one-line value proposition, and contact info. Failure mode: a tagline so abstract it could describe any startup. Cut the logo animation.
Problem: Make the pain specific and quantified. One sentence, one number. Failure mode: three paragraphs of market context. Cut the history lesson.
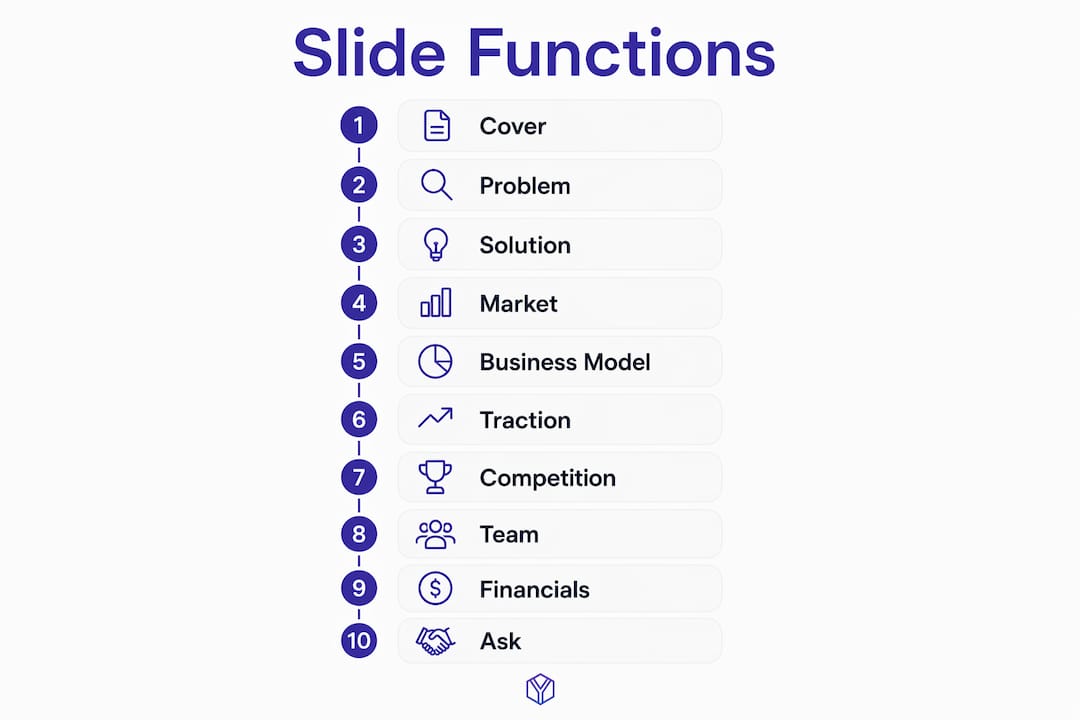
Solution/Value Prop: Lead with the outcome, not the mechanism. Bake in one traction signal here if you have it (“customers cut churn by 40%”). Failure mode: a feature list. Cut anything that reads like a product spec.
Market: Use bottom-up sizing tied to an ICP and unit economics. Investors question unsupported TAM numbers instantly. Cut the top-down “the global market is $4 trillion” opener.

Business Model/GTM: One slide, one revenue motion. Failure mode: six pricing tiers and three distribution channels. Cut the channel you haven’t tested.
Traction: Metrics only. MRR, DAU, retention, NPS, whatever your strongest signal is. Failure mode: logos without numbers. Cut the testimonial quotes.
Competition: Show strategy, not a feature tick-list. A 2x2 with axes that reflect your defensible niche plus a short “how we win” paragraph outperforms a checklist every time. Cut the column where every competitor gets an X.
Team: Photo, title, and three quantified credentials per founder. Investors spend disproportionate time on this slide when evaluating execution risk. Cut the advisor list from the main deck; move it to the appendix.
Financials: One page. Three-year projection, key assumptions visible, unit economics. Failure mode: a ten-tab model screenshot. Cut everything that requires a zoom.
Ask: One number, three milestones it funds, and your current round status. Failure mode: a range (“$1M–$3M”). Cut the range; pick the number.
Appendix: Move detailed financials, technical architecture, full advisor bios, and customer case studies here. Due diligence documents live here too, not in the main deck.
YC’s design standard is three words: legible, simple, obvious. Large type, high contrast, one idea per slide. The obviousness test: can someone who has never heard of your company understand the slide’s point in two seconds? If not, add an explicit caption or rewrite the headline.
How do you use engagement analytics to prioritize edits?
Per-slide engagement data tells you exactly where attention dies, which is far more useful than a friend’s general feedback. Here’s how to read the signals.
| Metric | What it signals | Prioritized action |
|---|---|---|
| Open rate below one minute | Subject line or sender context is weak | Rewrite the outreach email, not the deck |
| First-read time under 90 seconds | Slides 1–3 failed the filter | Rewrite cover and problem headlines |
| Per-slide dwell under 2 seconds | Slide is being skipped | Simplify visual or move content to appendix |
| Drop-off at slide 4–5 | Solution or market slide lost them | Restructure to lead with traction or team |
| Dwell over 30 seconds on one slide | Confusion or high interest | Add a clarifying caption or follow up directly |
| Full read, no reply | Deck passed; outreach timing is the issue | Follow up within 24 hours with a specific ask |
| Multiple re-opens | High interest, likely sharing internally | Prioritize this investor for a warm follow-up |
A two-week test cycle works like this:
- Pick one hypothesis. Example: “The solution slide headline is too feature-heavy.”
- Create one variation. Change only the headline; keep everything else identical.
- Distribute to a defined subset. Send version A to ten investors, version B to ten others.
- Measure for seven days. Track per-slide dwell on the solution slide and finish rate.
- Apply the decision rule. If version B shows 20%+ higher dwell and finish rate, roll it into the main deck. If results are within noise, iterate the hypothesis.
Pro Tip: Triangulate analytics with investor questions. If three investors ask the same question in follow-up emails, that’s a slide gap the data may not surface directly. Fix the slide before the next send.
How should you follow up based on what investors actually did?
Engagement states are not equal, and treating them the same way wastes your best leads.
-
Never opened: Wait 48–72 hours, then send a short re-send with a different subject line. Don’t reference the deck. Try: “Quick note — wanted to make sure this reached you.” If still no open after a second attempt, move to a warm intro channel.
-
Skimmed (under 90 seconds total): The deck didn’t hook them. Don’t re-send the same deck. Instead, send a two-sentence email that restates the single strongest signal: traction number, customer name, or why-now fact. Ask for 15 minutes, not a meeting.
-
Partial read (dropped at slide X): This is the most useful state. If they dropped at slide 4 (market), include the key market stat in the email body. If they dropped at slide 6 (traction), lead with your best metric. You’re supplying the content they missed, not re-sending the deck.
-
Full read, no reply: They read everything and passed silently, or they’re still deciding. Follow up within 24 hours. Reference that you’d value their perspective, not that you’re chasing a yes. A specific question (“Would the team slide change your view?”) gets more replies than a generic check-in.
Tracking without surveillance matters here. Founders who know what investors read can write relevant follow-ups; founders who guess send generic ones.
How do you shift your deck from features to purpose?
Unsuccessful decks lead with what the product does. Investors scan for why it matters and then evaluate whether the team can execute. The fix is a sequencing and framing shift, not a redesign.
Before (feature-heavy solution slide): “Our platform integrates with Salesforce, HubSpot, and Zendesk. It offers real-time dashboards, automated workflows, and a mobile app.”
After (purpose-first): “Sales teams using our platform close 30% more deals in the first 90 days. One integration, one dashboard, no manual data entry.”
The second version leads with the outcome, implies the mechanism, and gives an investor something to verify. Use these prompts to extract the same clarity from your own slides:
- What does the customer’s life look like after using this for 90 days?
- What would have to be true about the market for this to be a $100M business?
- What has this founding team done that makes them the right people to execute this, specifically?
On the team slide, three quantified facts per founder beat a paragraph bio every time. “Previously grew ARR from $0 to $4M at [Company]” is a credential. “Experienced operator with a background in SaaS” is not.
Pro Tip: Use a tool like Spark Concept’s idea checker to stress-test your product-market fit framing before it goes in the deck. If the tool surfaces gaps in your value proposition logic, investors will too.
What does a realistic refinement timeline and budget look like?
| Scope | Typical time | Realistic cost (USD) |
|---|---|---|
| Quick triage (headlines + slide order) | 1–3 days | — |
| Analytics-driven A/B test cycle | 2 weeks | — |
| Editorial pass (narrative rewrite) | 1–2 weeks | — |
| Designer pass (visual refresh) | 1–2 weeks | — |
| Full rewrite + design | 3–4 weeks | — |
Spend order matters. Narrative and first-three-slide polish deliver more return than cosmetic design. A beautifully designed deck with a weak problem slide still loses investors at slide two. Fix the words before you fix the pixels. When you do need outside help, a pitch deck consultant scoped to an editorial pass is usually faster and cheaper than a full agency engagement.
A 7-day testing plan you can run this week
- Day 1: Identify one hypothesis. Example: “My solution slide headline is too vague.” Write one alternative headline.
- Day 2: Create two deck versions. Change only the target element; keep all other slides identical.
- Day 3: Distribute version A to ten investors via your raise room. Log the send.
- Day 4: Distribute version B to a separate ten-investor subset. Use a different share link so engagement is tracked separately.
- Day 5–6: Collect per-slide dwell on the target slide, finish rate, and re-open rate for both versions.
- Day 7: Apply the decision rule. If version B shows a clear lift in dwell and finish rate, roll it into the main deck. If results are within noise (under 15% difference), the variable wasn’t the problem. Pick a new hypothesis and repeat.
KPIs to watch: first-three-slide completion rate, average dwell on the target slide, overall finish rate, and re-open rate. A lift in re-opens without a lift in finish rate usually means the opener improved but a later slide is still losing them.
Key Takeaways
Fixing the first three slides is the highest-leverage move in any deck refinement, because those slides determine whether an investor reads for the full average of 3 minutes and 44 seconds or closes the deck entirely.
| Point | Details |
|---|---|
| Fix slides 1–3 first | Cover, problem, and solution determine whether investors read past the 20–30 second filter. |
| Use per-slide dwell to triage | Under 2 seconds means a slide is being skipped; over 30 seconds signals confusion or high interest. |
| Match follow-ups to engagement state | A partial read at slide 4 means your email should supply the market stat they missed, not re-send the deck. |
| Lead with purpose, not features | Replace feature lists with a single quantified customer outcome on the solution slide. |
| BabyLoveRaise raise room | Tracks per-slide engagement, segments investors by read state, and supports targeted follow-ups in one workflow. |
What founders consistently get wrong about deck refinement
Most founders treat deck refinement as a design problem. It isn’t. The decks that get meetings are usually plainer than the ones that don’t, but they’re ruthlessly clear about three things: why the problem matters now, what the customer actually gets, and why this team can execute.
The engagement data makes this concrete. When a founder sees that investors spend 45 seconds on the team slide and 4 seconds on the market slide, the instinct is to fix the market slide. Sometimes that’s right. But often the team slide is holding attention because it’s raising questions, not answering them. A long dwell isn’t always a good sign. It can mean the investor is trying to figure out whether the credentials add up.
The other thing founders miss: the deck that travels is not the deck you present live. A slide that works with your voice explaining it will fail when an investor forwards it to a partner at 10 PM. Strong story arcs and clear sequencing increase engagement precisely because they don’t require narration. Every slide needs to stand alone.
The heuristic I’d file away: if you need to explain a slide, rewrite it.
BabyLoveRaise turns your raise room into a refinement engine
Sending a PDF and waiting is the old workflow. BabyLoveRaise gives you a hosted raise room where every send is tracked: first-read notification, per-slide dwell, finish rate, and re-open count, all mapped to individual investors. The two silences that look identical in your inbox (“never opened” and “read everything and passed”) become two different, prioritized follow-up queues.
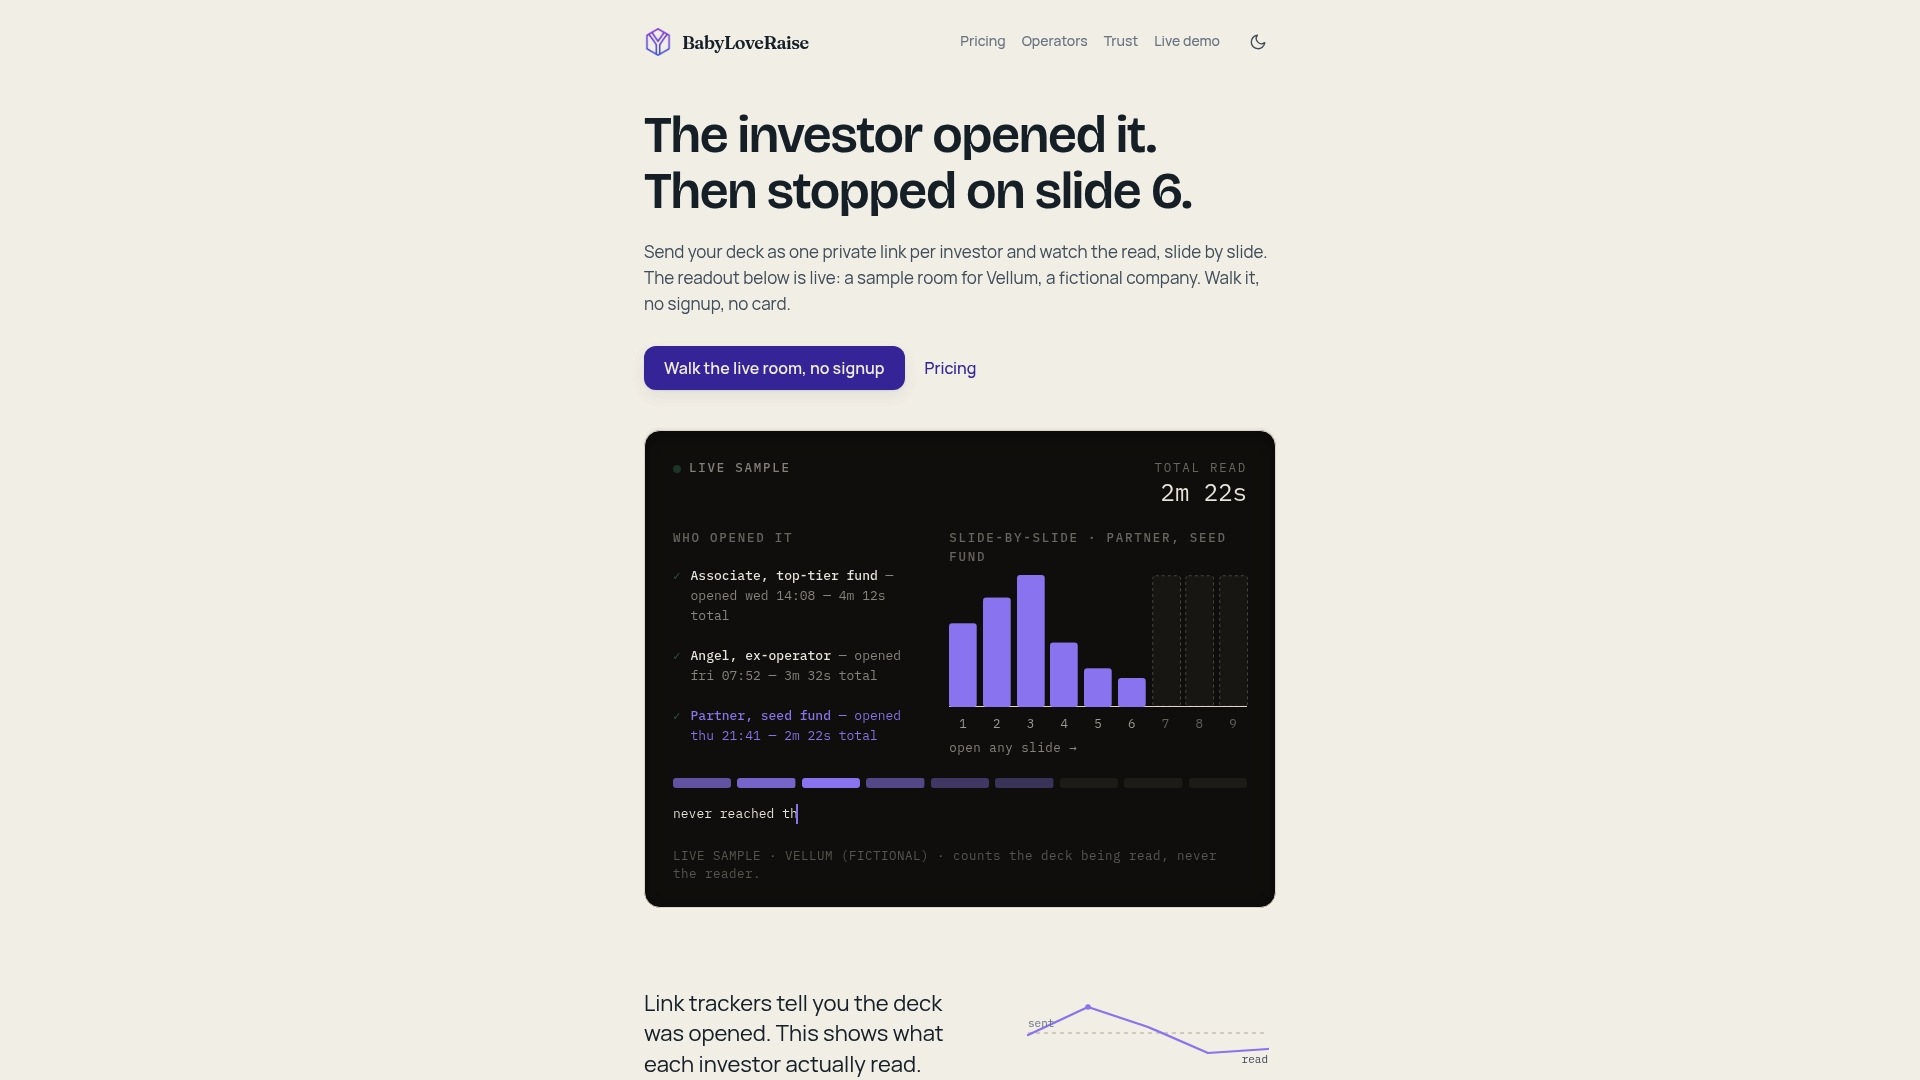
The features map directly to this guide’s workflow. Per-slide attention metrics tell you which slides to rewrite. Read-state segmentation (never opened, skimmed, full read) drives the follow-up scripts in Section 4. Measured watermarks protect the deck as it gets forwarded. A register privacy control reports on the document without surveilling the person. When the raise closes, the room converts to a permanent archive instead of a paywall cliff.
For advisors and fractional CFOs running multiple client raises, the white-label Operator tier runs firm-branded rooms across every client at a fraction of virtual-data-room pricing. Optional concierge editorial passes and narrative Build Map artifacts cover founders who want hands-on help with the narrative work this guide describes.
BabyLoveRaise is built specifically for fundraising document tracking, not generic file-sharing. See current plans and pricing and set up your raise room before the next send.
Sources and further reading
- What Investors Actually Read in Your Pitch Deck (DocSend Data) — PitchGrade: Source for the 3:44 average reading time benchmark and team/financials dwell data.
- How to Design a Better Pitch Deck — YC Startup Library: Legible, simple, obvious framework and standalone-slide design rules.
- Pitch Deck Structure in 2026: From 1,000+ Decks Reviewed — Waveup: Bottom-up market sizing guidance, competition slide strategy, and lead-with-strongest-signal framing.
- Engagement Analytics: Turn Data Into Winning Presentations — Pitch: Per-slide dwell and segmentation capabilities for targeted follow-ups.
- Data Tells Us That Investors Love a Good Story — TechCrunch: Evidence that narrative sequencing increases engagement and outcomes.
- BabyLoveRaise Blog: Fundraising best practices, pitch deck examples, and raise-room case studies.
- BabyLoveRaise Pricing: Plans for raise-room analytics, measured watermarks, and Operator tiers.
Run the 7-day testing plan from Section 7 this week. Use the appendix links above for pitch deck examples and canonical slide content guidance. The data from even one week of tracked sends will tell you more than a month of untracked outreach.