
Founders: Improve Deck Engagement With Per Slide Signals Via BabyLoveRaise
Track per investor, per slide signals like reopens, downloads, and dwell to rank leads, time outreach in 24–48 hours, and run your raise room with...
September 13, 2026 · 9 min read

Swap the PDF for a hosted, per-investor deck link and start reading behavior instead of guessing at it. The fastest lever is tracking who reopens or downloads the deck. Rank follow-ups by those signals first, move traction and financials into slides two and three, and fix whichever slide the funnel shows people abandoning.
TL;DR:
- Reopens and downloads of the deck are the strongest signals of genuine investor interest, especially when they occur within 24 to 48 hours after initial contact.
- Tracking which specific slides investors spend time on helps identify content that effectively retains attention and highlights where improvements are necessary.
- A deck with 9 to 16 slides, focusing on concise content and emphasizing traction early, increases completion rates and keeps investors engaged within their limited attention span.
- Prioritize follow-up based on engagement signals, such as quick reopen or download, rather than simply responding to opens or skims, and tailor messages to the slides they spent time on.
- Using a hosted, per-investor deck link with automated tracking simplifies measurement, enables timely follow-up, and prevents miscommunication across multiple fundraising efforts.
BabyLoveRaiseSee Which Slides Hold AttentionBabyLoveRaise turns your fundraising deck into a hosted room with per-slide engagement signals and actionable investor follow-up data.Explore BabyLoveRaise
Table of Contents
- Which Engagement Signals Actually Predict Investor Interest?
- How Do You Measure Per-Investor, Per-Slide Engagement?
- How Should You Prioritize Follow-Ups From Engagement Data?
- What Slide Changes Actually Increase Completion Rates?
- What’s the Weekly Workflow for Acting on Engagement Data?
- Measurement Builds Trust When You Use It Right
- How BabyLoveRaise Turns This Playbook Into a Working Room
- Sources
- FAQ
Which Engagement Signals Actually Predict Investor Interest?
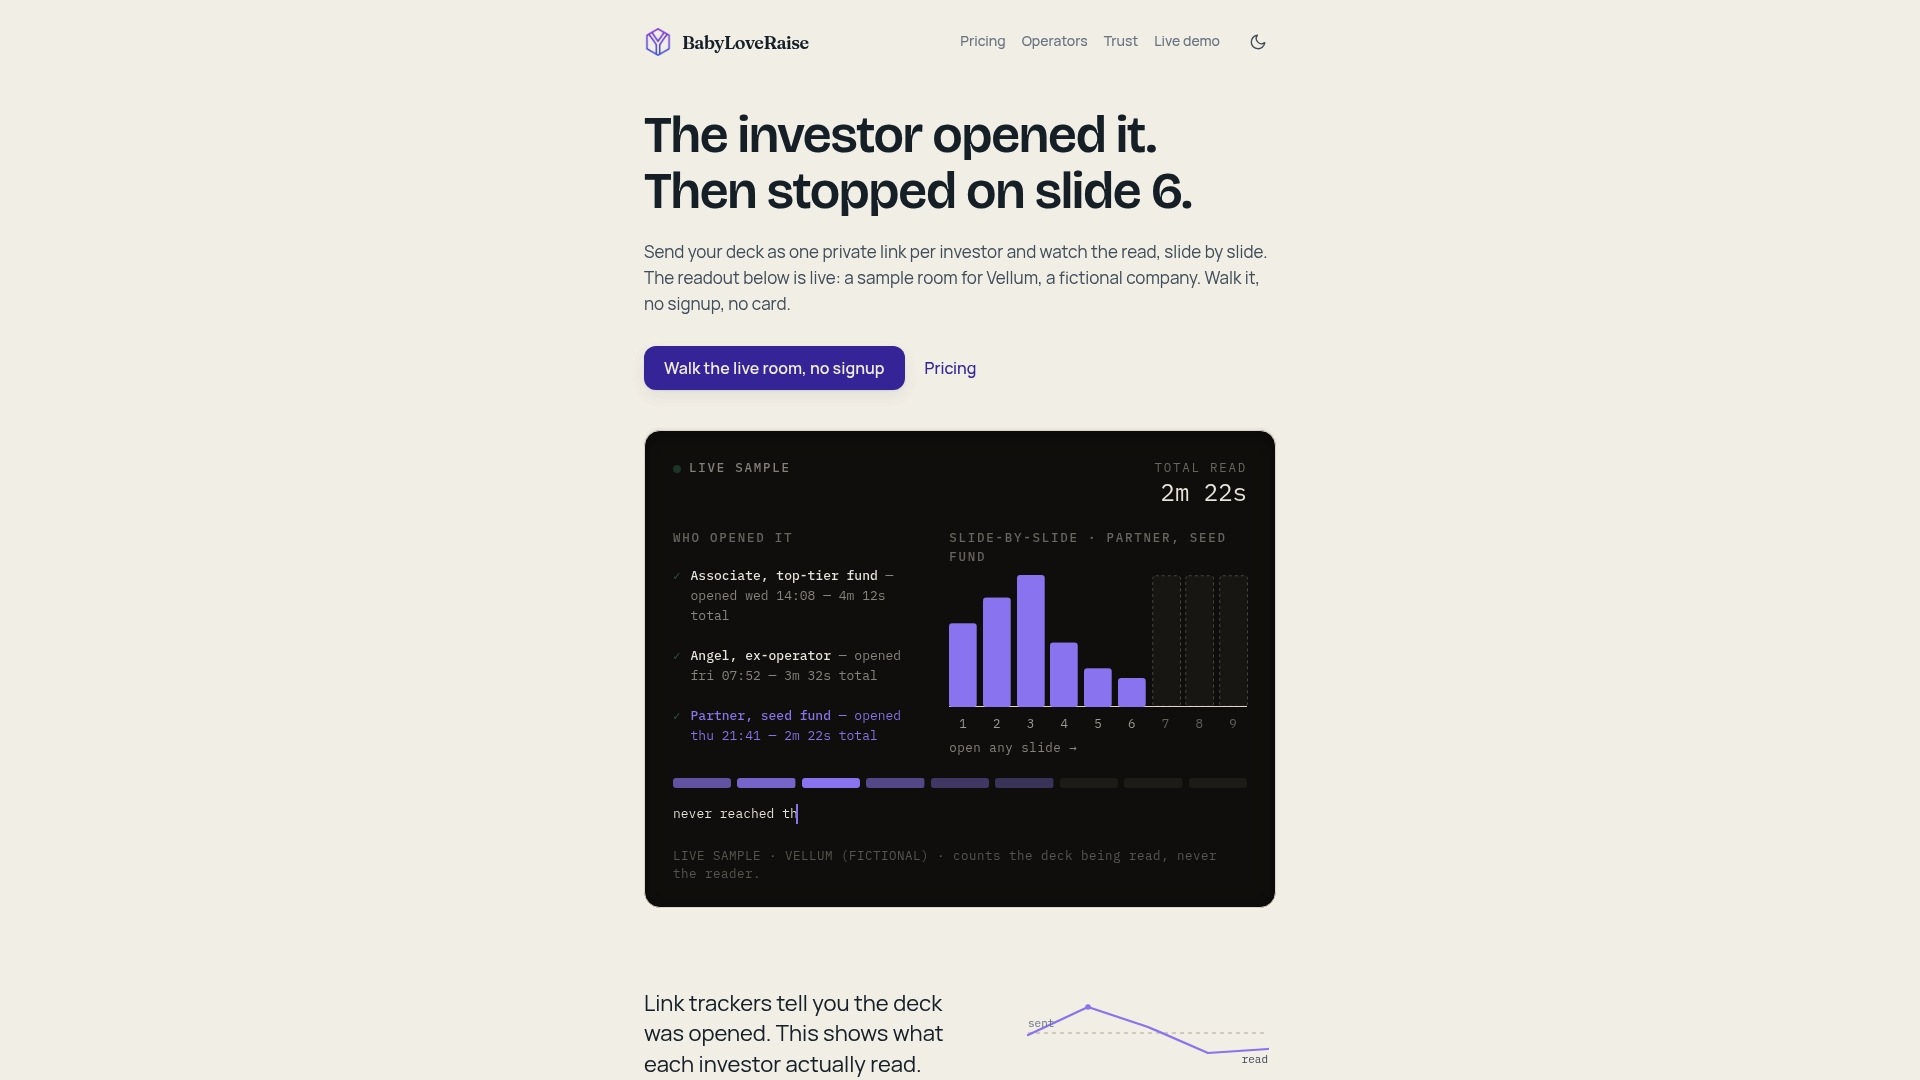
Not every open means the same thing, and treating them as identical costs you real meetings. The slide-by-slide funnel is where the truth lives: it shows exactly which page a reader stalls on before closing the tab, and where the attention actually leaks out.
A single open with a fast exit is close to noise. A reopen or a download is a different animal entirely. It usually means the investor pulled the deck back up for a partner meeting or forwarded it internally for a second opinion, and both behaviors correlate far more strongly with real interest than a first click ever does.
Median dwell time across investor reads is under two minutes, so you’re really only earning a few slides’ worth of attention on a cold first pass. Separate median from average when you’re reading your own dashboard: a handful of long, careful reads can drag the average up and mask the fact that most people are skimming.
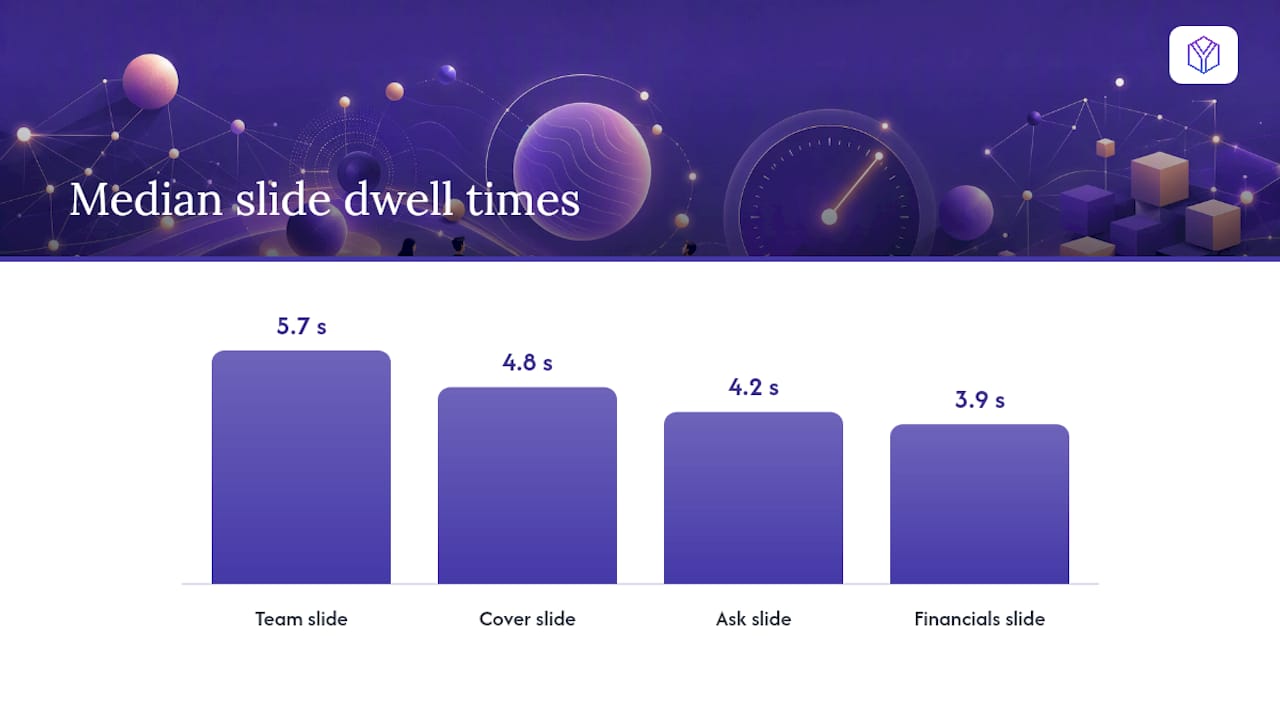
- Team slide: median 5.7 seconds of dwell, typically the highest-attention slide in the deck
- Cover slide: 4.8 seconds
- Ask slide: 4.2 seconds
- Financials slide: 3.9 seconds, despite only about 40% of decks including one
That last figure is worth sitting with. Financials pull strong attention whenever they’re present, yet many founders omit them, missing an important opportunity to hold reader attention.
How Do You Measure Per-Investor, Per-Slide Engagement?
Setting this up right takes less than an hour, and the payoff is a dashboard that separates “never opened it” from “read the whole thing and passed.”
- Generate a unique link for every investor on your target list, and keep one canonical deck version live per raise so signals don’t fragment across copies.
- Decide upfront whether you’ll gate views behind an email or allow anonymous access. Gating gets you identity; going open gets you more raw views and relies on forwarded-link detection to flag internal sharing.
- Confirm your viewer logs opens, session count, per-slide timestamps, reopens, downloads, and the source channel, whether that’s email, a QR code, or an embedded link.
- Label deck versions clearly (v1, v2, v3) so a redesign doesn’t erase your read on which slides were working before.
- Export the data weekly as a CSV and run it against your pipeline so stale leads don’t sit untouched for three weeks.
Pro Tip: Don’t gate your first send to a warm intro. A friendly investor who has to enter an email before seeing slide one will notice, and it adds friction exactly where you need none.
How Should You Prioritize Follow-Ups From Engagement Data?
Engagement data is only useful if it changes what you do next, and most founders under-use it by treating every open the same way. Work down this ladder instead of working through your list alphabetically:
- Reopen or download: contact within 24 to 48 hours. This is your highest-value signal and it usually means someone else is now looking at the deck too.
- Reached the traction or financials slides: follow up within 24 to 72 hours with the specific data that slide referenced.
- Long dwell on funding-related slides without a full read: worth a warm check-in inside a week.
- Multiple sessions, no download: still active interest. Nudge gently rather than pushing hard.
- One long single read, no return visit: low urgency, but keep on the list.
- Skims or no opens at all: deprioritize unless you can warm the intro first.
Lead every message with the slide they actually spent time on, and never mention that you’re tracking their behavior. Say “wanted to send over the updated unit economics” instead of “I saw you looked at slide 9.” If someone hasn’t opened the deck after a full week, or opens it repeatedly for only a few seconds each time, that’s your signal to stop chasing and focus energy elsewhere.
What Slide Changes Actually Increase Completion Rates?
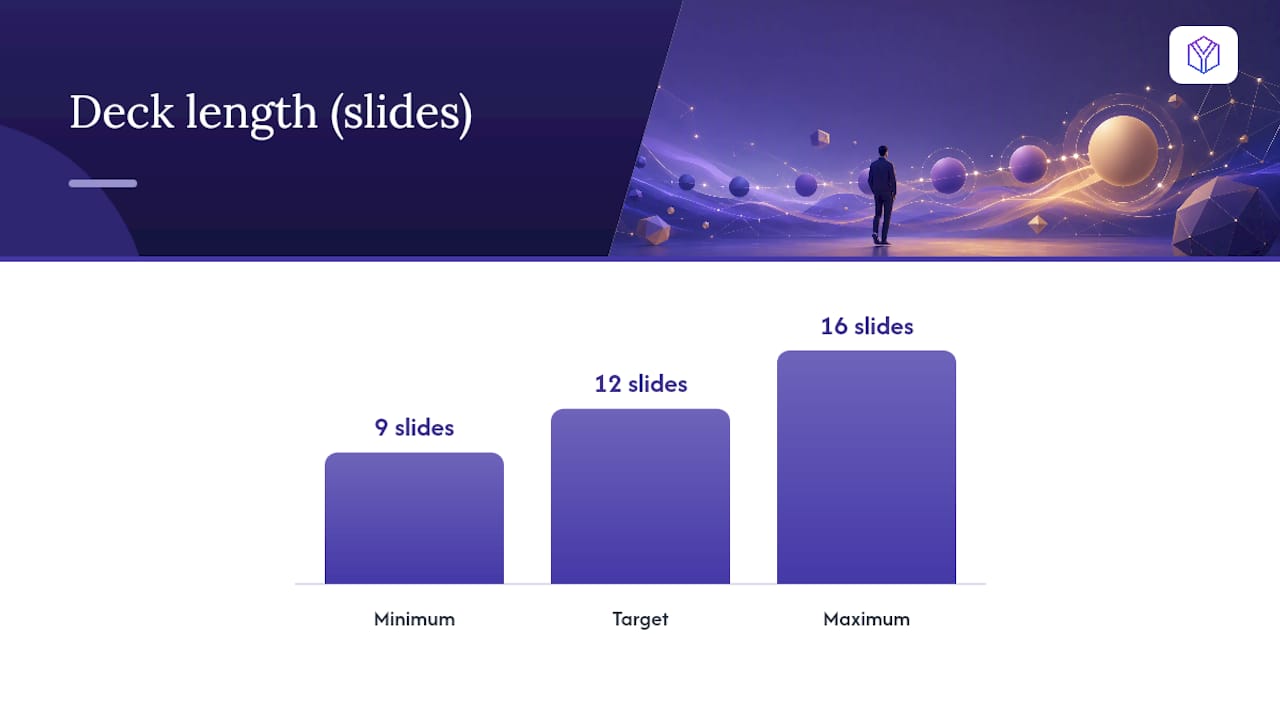
Length and order matter more than most founders assume before they see their own funnel data. Twelve slides is close to the sweet spot: enough room to make your case, tight enough to survive a 77-second attention window.
- Cap the deck at 9 to 16 slides, with 12 as the target. Move traction into slide two or three and pull financials earlier than instinct suggests. Keep the ask isolated on its own slide, not folded into the close.
- Design for a 20 to 30 second read per slide. One idea, one supporting metric, nothing that needs a second pass to parse. If a slide needs explaining out loud to land, it’s failing on the page.
- Build a compact financials slide: run rate, burn, runway, and one unit-economics snapshot. Skip the five-year projection table. It’s the least-trusted slide in any pre-seed deck and it eats attention you need elsewhere.
- Polish the team slide with photos and two sharp credentials per founder, since it consistently earns the most dwell time in the deck. Include exactly one clickable link, whether that’s a live demo, a metrics dashboard, or a customer reference.
A tool like AmmarAI’s presentation maker can speed up the visual pass once your structure is locked, and something like Fiatmap’s embeddable widgets works well if you want a live metrics card rather than a static screenshot on your traction slide.
Pro Tip: If your funnel shows the same drop-off point across five or more investors, that slide is broken. Fix that one slide before you touch anything else in the deck.
What’s the Weekly Workflow for Acting on Engagement Data?
One canonical raise-room per fundraise keeps your signal clean. Every time you revise the deck, label the new version and update the link rather than starting a fresh room, or you’ll lose the history that tells you what was and wasn’t working.
- Assign a unique link to each investor at first send, and log which channel it went out through.
- Run a weekly triage: sort every lead by engagement score and move the top tier into immediate outreach.
- Key your follow-up templates to what they actually engaged with. A financials-focused follow-up should carry a one-page data pack, not a generic “checking in.”
- If fewer than five people on your target list have opened the deck at all, the problem isn’t the slides. It’s the intros. Strengthen those before you touch the design.
Advisors running several client raises should keep each client’s link register and version history separate, even when using one dashboard across accounts. Crossed signals between two unrelated raises are a fast way to give a founder bad advice.
Measurement Builds Trust When You Use It Right
The instinct to weaponize engagement data is strong, and it’s the wrong move. Naming a specific slide someone lingered on in a cold follow-up doesn’t read as diligence. It reads as surveillance, and investors notice immediately when a founder crosses that line.
The better move treats tracking as a lens on the document, never the person. BabyLoveRaise’s per-slide analytics work this way by design: the dashboard tells you a slide got skimmed, not that a specific partner has cold feet. Use the data to fix the deck and time your outreach. Never quote it back to the investor.
Advisors juggling multiple client raises should hold themselves to the same standard across every account. One consistent etiquette rule, applied the same way for every client, is worth more than a clever prioritization trick.
— Paul
How BabyLoveRaise Turns This Playbook Into a Working Room
BabyLoveRaise is the direct implementation of everything above, minus the spreadsheet you’d otherwise build to track it yourself. Instead of piecing together link shorteners and a shared doc, you get one raise room that already does per-slide dwell tracking, reopen and download notifications, and three link registers, first send, forwardable, and private, so you always know how a link is meant to behave before you send it.
Downloads can carry a measured watermark, and when the raise closes, the room converts to a free permanent archive instead of hitting a paywall wall the way some document trackers do. Setting up the workflow from this article takes minutes: create the room, assign per-investor links to your target list, and run your weekly triage straight from the owner dashboard. If a specific slide keeps losing readers, an editorial pass can fix that slide without a full redesign. Advisors and fractional CFOs managing several client raises can run multiple raises under one branded tier. Visit the BabyLoveRaise trust page to see the privacy model and start your first raise room today.
Sources
- How Investors Read Pitch Decks — Data from 24,541 Decks
- What Investors Actually Read in Your Pitch Deck (DocSend Data) - PitchGrade
FAQ
How Long Should an Investor Pitch Deck Be?
Aim for 9 to 16 slides, with 12 as the sweet spot that collects the most views and return visits without losing readers to fatigue.
What’s the Best Signal That an Investor Is Seriously Interested?
A second open or a download beats a first read every time, since it usually means the deck is being pulled up again for a partner meeting or forwarded for internal discussion.
Should I Mention Tracking Data in My Follow-Up Email?
No. Lead with the slide’s content, like updated metrics or unit economics, and never reference that you saw them open or linger on a specific page.
Which Slide Gets the Most Investor Attention?
The team slide typically holds attention longest, with a median dwell of 5.7 seconds, followed by the cover, ask, and financials slides.
How Do I Track Per-Investor Engagement Without a Big Data Team?
A hosted raise room like BabyLoveRaise assigns unique per-investor links automatically and surfaces reopens, downloads, and per-slide dwell on one dashboard, no spreadsheet required.