
Per-Slide Analytics for Pitch Decks: A Founder's Guide
Discover how per-slide analytics can boost your pitch deck's effectiveness. Track viewer engagement and optimize fundraising efforts today!
August 9, 2026 · 10 min read

Yes, you can get reliable slide-level engagement data today. The fastest path is a hosted raise room or tracked share link that logs time on each slide, completion rate, and session-level views server-side. For pitch decks specifically, a fundraising-focused raise room gives you the metrics that matter without turning investor sessions into a surveillance log.
Before picking a tool, confirm it covers these five things:
- Per-slide dwell time — how long each viewer spent on every slide, not just total session time
- Completion rate — whether the viewer reached the last slide
- Session-level views — individual opens, not just aggregate page hits
- CTA click mapping — which links or calls to action on specific slides got clicked
- Privacy controls — document-level tracking with no personal profiling of the reader
BabyLoveRaise is the recommended option for founders. It is built around the raise itself, not generic file sharing, and the sections below explain exactly why that distinction matters.
Key Takeaways
Per-slide analytics give founders a clear picture of which slides hold attention and which lose investors before the ask, making follow-up and deck iteration far more precise.
| Point | Details |
|---|---|
| Hosted raise rooms win on reliability | Server-side session logging captures per-slide dwell and completion rate more accurately than embedded pixels or offline file instrumentation. |
| Completion rate is the headline metric | Track sessions reaching the last slide divided by total opens; 40–60% is a directional target for cold outreach. |
| Drop-off between slides 2 and 3 is the most common weak point | Investors decide quickly; a confusing problem slide kills the read before the team or traction slides appear. |
| Per-raise pricing fits a fundraise better than per-seat | A per-raise model keeps costs proportional to one raise cycle rather than accumulating indefinitely. |
| BabyLoveRaise is built for this use case | First-read notifications, per-slide dwell, and three link registers give founders the signals they need without profiling investors. |
Table of Contents
- How does per-slide analytics actually work?
- How to add slide tracking to PowerPoint, Google Slides, and PDFs
- How to read per-slide numbers and take action
- What pricing and privacy trade-offs should you expect?
- Why BabyLoveRaise works for pitch decks and key metric formulas
- What running pitch-deck analytics actually taught me
- BabyLoveRaise gives founders a raise room built around per-slide data
- Primary sources and further reading
- Sources
How does per-slide analytics actually work?
Three technical patterns power slide engagement analytics, and each has a different reliability ceiling.
Hosted raise room / tracked link. The deck lives on a server. When a viewer opens the link, the platform logs a session and timestamps every slide transition. This is the most reliable method because the data never leaves the host’s control. Completion rate, per-slide dwell, and click events are all captured cleanly.
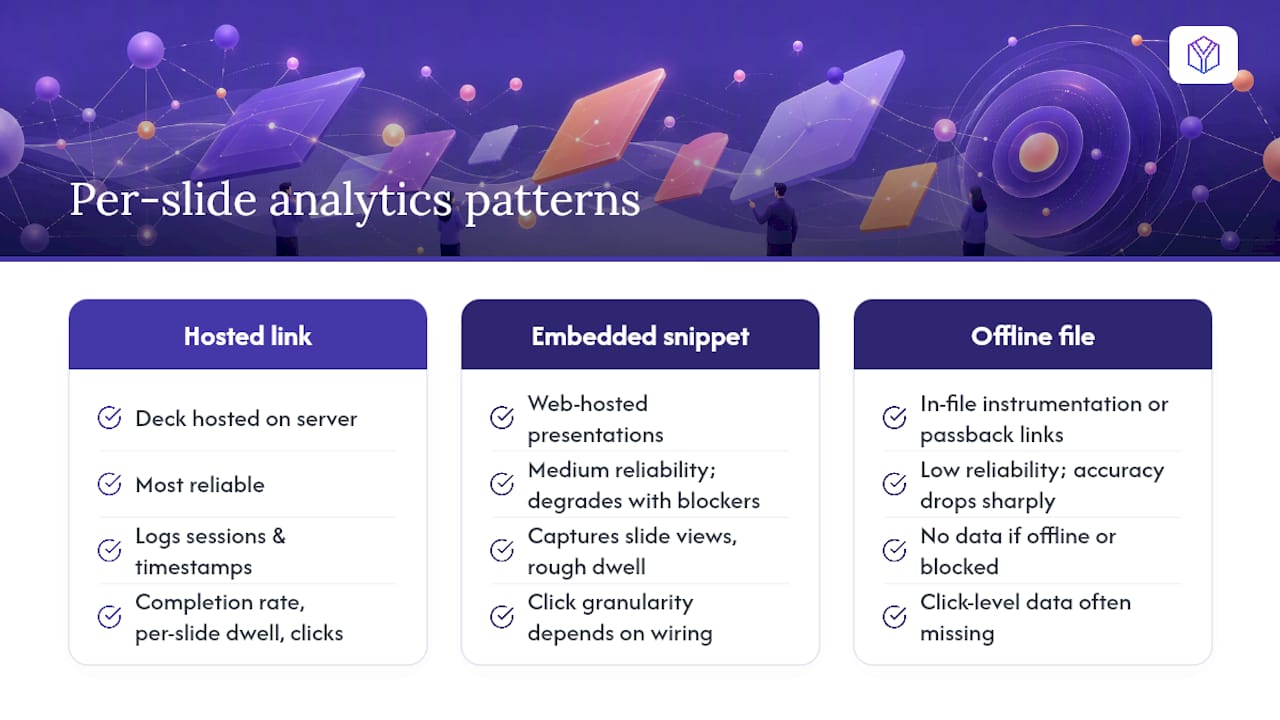
Embedded tracking pixel or JavaScript. A snippet fires on each slide view inside an iframe or web page. This works well for web-hosted presentations but degrades when viewers block scripts or use aggressive privacy browsers. It can capture slide views and rough dwell time, but click-level granularity depends on how carefully the snippet is wired.
Offline file instrumentation. Some tools package analytics directly into an exported file or use passback links inside a PDF. Accuracy drops sharply here. A viewer who opens the file offline, or whose PDF reader blocks outbound calls, generates no data at all.
The data flow for the first two patterns follows a consistent shape: upload the deck, generate a share link, the viewer opens it, the platform captures session events, and the dashboard aggregates them into per-slide metrics. CRM integration usually works through UTM parameters on the share link or a native webhook that pushes session data to tools like HubSpot or Salesforce.
Pro Tip: Session-level deck engagement is a sensible privacy balance. You learn which slides held attention and whether the investor finished the deck. You do not learn anything about the person beyond what they chose to show you by reading.
How to add slide tracking to PowerPoint, Google Slides, and PDFs
The workflow is the same regardless of format: choose a hosting method, prepare the file, create a tracked link, test it, then collect data.
- Choose your hosting method. A dedicated raise room (like BabyLoveRaise) gives you the cleanest per-slide data. A general document host works for sales decks. A self-hosted page with embedded analytics is viable but requires more setup.
- Prepare the deck. Add UTM parameters to any hyperlinks inside the slides. If you want QR-code CTAs on specific slides, generate them before uploading so click events are attributable to the right slide.
- Upload or export. PowerPoint: export as PDF or publish directly to the tracking service. Google Slides: use “Publish to web” and embed in a tracked page, or upload the exported file to a raise room. PDF: upload directly to any tracking room that accepts PDF uploads.
- Generate a tracked share link. Never email the file itself. A tracked link keeps the session data tied to the platform and avoids the identifier-leakage risk that comes with emailed attachments.
- Run a test session. Open the link yourself on both desktop and mobile. Confirm that slide timestamps fire, CTA links register as clicks, and the session appears in the dashboard.
- Collect and export. Most platforms offer a views-per-slide bar chart and a CSV export for deeper analysis.
A few format-specific notes:
- PowerPoint: the native “Share” link does not log per-slide data. You need to upload to a tracking service or export to PDF first.
- Google Slides: Google Analytics 4 can capture page-level events on an embedded presentation, but it will not give you per-slide dwell without custom event tagging.
- PDFs: the simplest option. Upload to a raise room and the platform handles the rest.
Privacy warning: emailing a tracked file (rather than a tracked link) can expose viewer identifiers to anyone who forwards the attachment. Always share via link, not attachment.
How to read per-slide numbers and take action
The metrics you will see in most dashboards break down into a short list:
- Average time per slide — total time on a slide divided by the number of views
- Median time per slide — less sensitive to outliers than the average
- Slide views — how many sessions reached that slide
- Completion rate — sessions that reached the last slide divided by total sessions
- Drop-off rate — the percentage of viewers who exited at each slide
- CTA click-through rate — clicks on a slide’s link divided by views of that slide
Low time combined with high exit at a specific slide is the clearest signal in pitch-deck analytics. It usually means the slide is confusing, the visual is too dense, or the CTA arrived before the viewer was ready. The fix is almost always one of three things: rewrite the headline, simplify the data presentation so a single statistic carries the slide, or move the CTA one slide later.
For A/B testing slide variants, the workflow from Skywork’s instrumentation guide suggests a practical setup time and analysis cycle sufficient for iteration. Route a portion of your share links to variant B, let both versions accumulate at least 20 sessions each, then compare completion rates and average dwell on the changed slide.
Pro Tip: With small samples (under 30 sessions), treat per-slide dwell as directional, not definitive. A single investor who spent 4 minutes on your financials slide will skew the average. Use median time as your primary signal when samples are thin.
Directional benchmarks to calibrate against, drawn from industry guidance:
| Metric | Directional target |
|---|---|
| Deck completion rate | a moderate percentage considered typical for cold outreach |
| Average time per slide | a range of several seconds is typical for content slides |
| Poll / interactive participation | common participation is often substantial in live sessions |
| CTA click-through on a specific slide | varies depending on the call to action |
What pricing and privacy trade-offs should you expect?
Pricing for slide analytics tools follows four shapes:
- Freemium — limited views or sessions per month, no session-level retention
- Per-raise or per-room subscription — you pay for the duration of a fundraise, not forever; this is the model BabyLoveRaise uses
- Per-seat — monthly cost per user, common in enterprise sales tools
- Enterprise / white-label — operator consoles for agencies or advisory firms running multiple client decks
Per-seat pricing adds up fast for a solo founder running one raise. A per-raise model keeps costs proportional to the actual use case.
On privacy, the checklist that matters:
- Does the tool track the document, not the person? Session-level engagement data (which slides, how long) is defensible. Personal profiling (device fingerprinting, cross-site tracking) is not.
- What is the data retention policy? You want session logs available for the life of the raise, not deleted after 30 days.
- Can you export data to a CRM or spreadsheet? Vendor lock-in on your own engagement data is a real risk.
- Is there a consent disclosure you can show investors? Some founders add a one-line note in their outreach email that the deck link includes engagement tracking.
Viewer experience matters too. A large file hosted on a slow CDN will show artificially low dwell times because viewers leave before the slide renders. Test load time before sending to investors. For privacy-aware tracking details, BabyLoveRaise publishes its approach openly.
Why BabyLoveRaise works for pitch decks and key metric formulas
BabyLoveRaise measures what founders actually need: first-read notifications (so you know the moment an investor opens the deck), per-slide dwell time, per-slide clicks, completion rate, and deck version comparisons across a raise. The dashboard separates “never opened” from “read everything and passed,” which changes how you prioritize follow-ups entirely.
The Operator tier lets fractional CFOs and fundraising advisory firms run firm-branded raise rooms across multiple client decks, at a fraction of virtual data room pricing. Optional editorial add-ons (deck editorial passes, narrative Build Map artifacts) cover founders who want hands-on help alongside the analytics.
Two workflows where this plays out:
Follow-up sequencing after a first read. The first-read notification fires the moment an investor opens the link. You can follow up within hours, while the deck is still fresh, rather than guessing whether they ever looked at it. Investors who completed the deck get a different follow-up than those who dropped off at slide 3.
Iterative deck improvement. Compare dwell time across two versions of the same slide. If version B holds attention 30% longer on the problem slide, that is the version you keep. Pair engagement data with a slide quality framework that checks content, aesthetics, and clarity so you are not just optimizing for clicks on a confusing slide.
Metric formulas for quick reference, mapped to carousel-analog calculations:
| Metric | Formula |
|---|---|
| Completion rate | Sessions reaching last slide ÷ total sessions |
| Average time per slide | Total time on slide ÷ number of views |
| Last-slide (swipe-through) rate | Last-slide views ÷ first-slide views |
| CTA conversion per slide | Clicks on slide CTA ÷ slide views |
| Engagement score (composite) | (Completion rate × factor) + (avg. dwell score × factor) |
For a deeper look at how these metrics apply to investor outreach, the BabyLoveRaise blog covers follow-up sequencing in detail.
What running pitch-deck analytics actually taught me
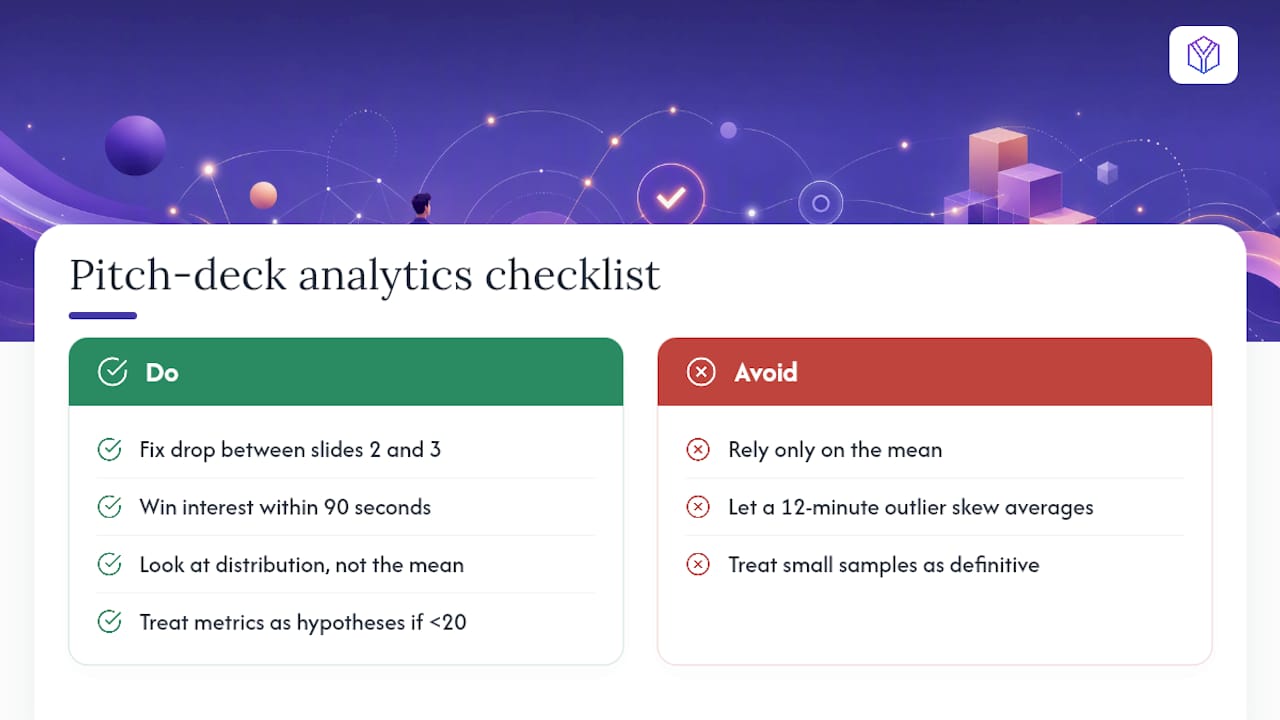
The number that surprises most founders the first time they see per-slide data is not the completion rate. It is the drop-off between slide 2 and slide 3. Investors who open a cold deck give you roughly 90 seconds before they decide whether to keep reading. If your problem slide does not land, the rest of the deck is invisible.
The second lesson: a single outlier session (one investor who spent 12 minutes on your traction slide) will make your averages look better than they are. Always look at the distribution, not just the mean. When your sample is under 20 sessions, treat every metric as a hypothesis, not a verdict.
BabyLoveRaise gives founders a raise room built around per-slide data
Most document-tracking tools were built for sales teams sharing contracts. BabyLoveRaise was built for the specific shape of a fundraise: a short window, a small list of investors, and a deck that needs to work without you in the room.
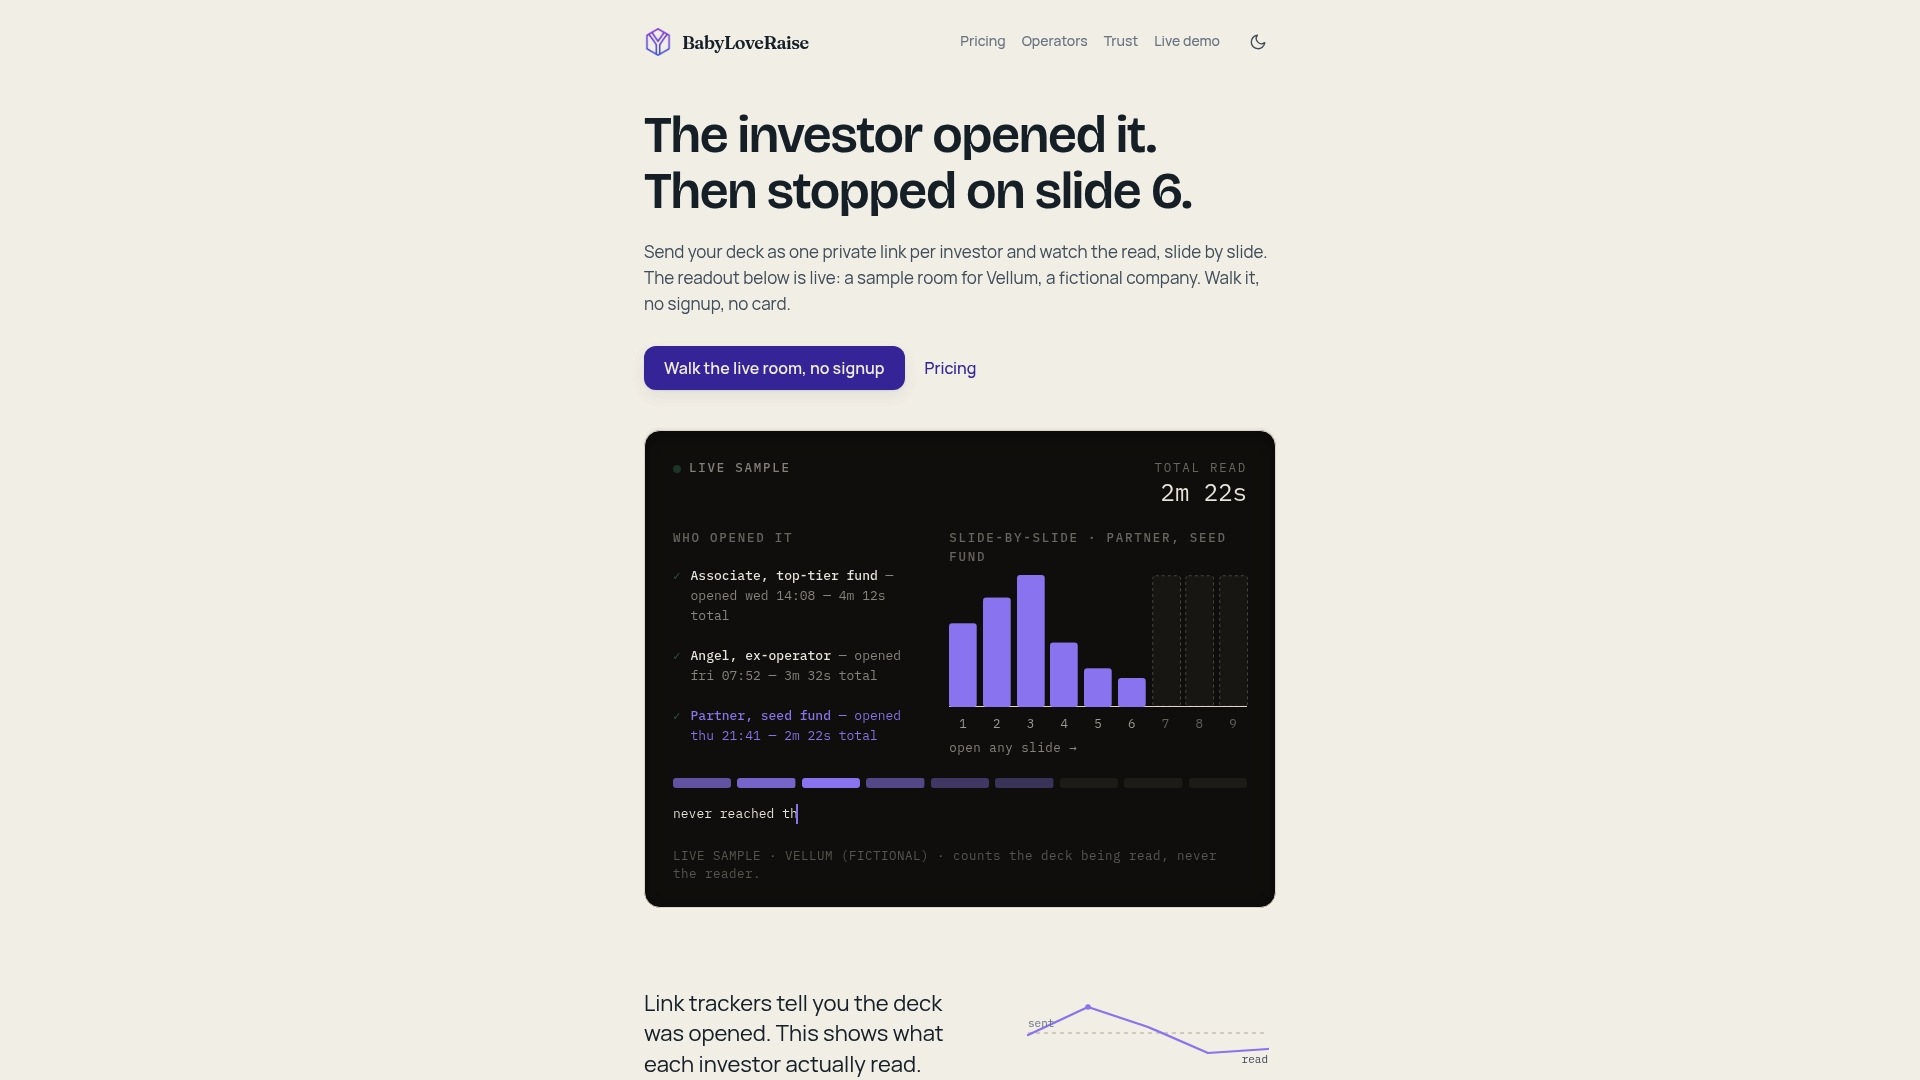
You get first-read notifications, per-slide dwell, completion tracking, and three link registers (first send, forwardable, private) in one raise room. When the raise closes, the room becomes a free permanent archive rather than a paywall. The Operator tier covers advisory firms running multiple client raises. See pricing and plan details, or create your raise room and send your first tracked link today.
Primary sources and further reading
- Presentation Analytics & Live Feedback (Showslide) — example of a dashboard that consolidates per-slide engagement, session duration, and viewer reactions.
- 10 Crucial Metrics to Track Carousel Post Performance (PostNitro) — metric definitions and calculation examples for swipe-through rate, engagement rate, and time spent that map directly to slide analytics formulas.
- SlidesGen-Bench (GitHub) — evaluation framework for slide quality across content, aesthetics, and editability; useful for pairing with engagement data when deciding whether a slide needs a content or design fix.
- Using analytics for your presentation (HyperMatic docs) — explains views-per-slide bar charts and CSV export options common across presentation analytics platforms.
- How to Present Data Effectively (Slidesgo) — design principle recommending a single focal statistic per slide; directly applicable when rewriting low-engagement slides.
Sources
- Presentation Analytics & Live Feedback | Showslide
- 10 Crucial Metrics to Track Carousel Post Performance
- YunqiaoYang/SlidesGen-Bench
- Using analytics for your presentation
- How to Present Data Effectively - Tutorial - Slidesgo