
Fundraising Document Analytics: 48 Hour Follow Up for Founders, CFOs
Concise playbook for pre-seed founders and fractional CFOs. Use per-investor tracked links, three priority signals, and 48/24–72 hour follow-up rules to...
September 14, 2026 · 9 min read

Fundraising document analytics let you see who opened your pitch deck, which slides they lingered on, and when to follow up, so your limited outreach hours go to investors who actually engaged. The moment you replace a mailed PDF with a tracked link, “never opened it” and “read every slide and passed” stop looking identical. Some tools build this tracking directly into a hosted raise room, turning that data into a ranked follow-up list instead of a guessing game.
TL;DR:
- Engagement over five minutes, multiple sessions, and a return visit within a few days are strong indicators of investor interest.
- High-interest investors from the same firm showing complete or repeated deck views should be prioritized for same-day follow-up.
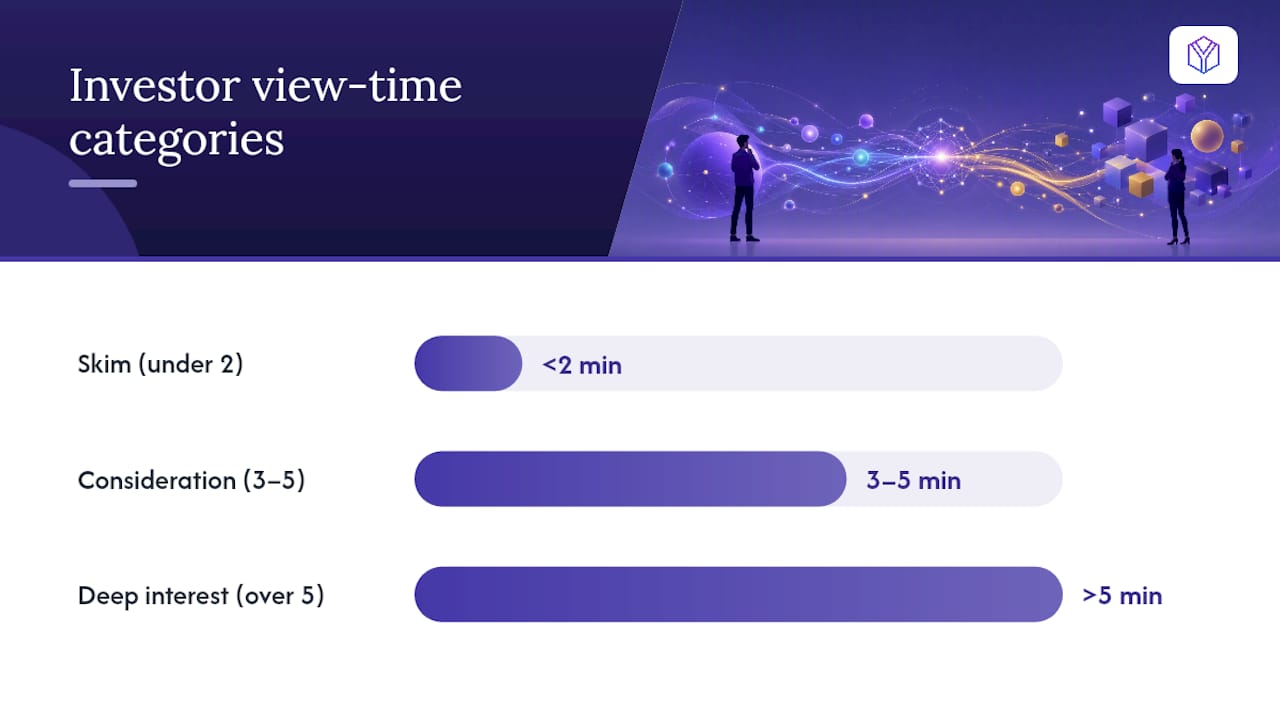
- Under two minutes of total view time usually indicates a quick skim, while over five minutes suggests deep reading and potential interest.
- Avoid referencing exact engagement times in follow-ups to prevent appearing invasive; instead, use signals to inform your messaging.
- Tracking multiple investors with unique links and setting timely follow-up cadences improves your chances of converting engagement into meetings.
BabyLoveRaiseSee Which Investors Read Your DeckBabyLoveRaise gives founders a hosted raise room with first-read notifications and per-slide engagement analytics for smarter follow-ups.Explore BabyLoveRaise
Table of Contents
- What Metrics Fundraising Document Analytics Track
- How Do You Prioritize Follow-Ups From Deck Analytics?
- What Do Typical View Times and Slide Patterns Mean?
- What Should You Say (and Not Say) in a Follow-Up?
- How Do You Instrument a Raise With Trackable Links?
- Common Pitfalls When Reading Fundraising Analytics
- Why Analytics Changed How I Think About Founder Time
- Instrument Your Next Raise With BabyLoveRaise
- Sources
- FAQ
What Metrics Fundraising Document Analytics Track
A raw open notification tells you almost nothing on its own. It’s the combination of signals that turns into a real read on investor intent.
- Open notifications with investor identity. A per-investor link tells you exactly who opened the deck, not just that “someone” did.
- Total view time and session count. Multiple short sessions over a week often signal more genuine interest than one long sitting, especially if the investor is coming back to check specific numbers.
- Slide-level dwell time and completion rate. This is where you find out if someone read the whole story or bailed after the problem slide.
- Forwarding and multiple viewers. When two or three people at the same firm open the link, that’s usually a sign the deck reached a partner meeting or internal Slack thread.
- Downloads, watermarks, and NDA gates. These operational flags matter less for ranking interest and more for knowing where your deck physically ended up.
Hosted, trackable links give you per-page analytics that a static PDF simply cannot. A file sent as an email attachment gives you zero visibility once it leaves your outbox.
How Do You Prioritize Follow-Ups From Deck Analytics?
Rank every open investor by combining three things: total view time, whether they returned for a second session, and how far they got through the deck. That combination sorts your pipeline into hot, warm, and cold tiers without you having to guess based on how a call “felt.”
- Hot: high engagement, fast follow-up. Multiple viewers from the same firm, a completed read-through, and a return visit within 48 hours. Reach out the same day, ideally with a direct meeting request.
- Warm: moderate signal, structured cadence. One viewer, moderate view time, no return visit yet. Follow up within 24 to 72 hours with a value-add update, not a hard ask.
- Cold: low or no engagement. Deck opened once briefly, or never opened at all. Deprioritize, but don’t drop, since a single late-night return visit two weeks later can flip this tier fast.
Timing matters because interest decays. An investor who spends over eight minutes on a deck is roughly three times more likely to schedule a follow-up meeting than one who spends under three, and that window of enthusiasm doesn’t stay open indefinitely.
Frame your outreach around the topic that likely drove attention, never the tracked number itself. “Wanted to share more detail on our unit economics” works. “I saw you spent six minutes on slide 9” does not, and it will read as invasive to almost every investor who receives it.
Pro Tip: Treat your raise like a funnel, not a broadcast list. Tracking conversion rates between outreach, opens, and meetings shows you exactly where investors drop off, whether that’s your cold email subject line or slide 4 of the deck itself.
What Do Typical View Times and Slide Patterns Mean?
Raw minutes only mean something once you compare them against rough benchmarks for early-stage decks.
- Under 2 minutes total: a skim. The investor glanced at the deck, likely during triage, and probably didn’t reach your financials.
- 3 to 5 minutes: serious consideration. This range usually means someone read the core narrative and traction slides.
- Over 5 minutes: deep interest, particularly when paired with a return session a few days later.
Average seed-stage view times in recent pitch-deck engagement analyses hover around 2 to 3 minutes per deck, which means anything meaningfully above that range is worth flagging for immediate follow-up.
Certain slides act as filters rather than content. The first three slides decide whether an investor keeps reading at all, and a high drop-off rate there usually points to a weak hook, not a weak business. Traction and financials slides tend to get the longest dwell times from serious investors, since that’s where they’re checking your numbers against their thesis.
Watch for specific patterns. An investor who jumps straight to your financials slide and lingers there is likely doing quick diligence before deciding whether to take a call. A returning viewer who re-opens the link three days later, skips the intro, and goes straight to your team slide is probably comparing you against another deal. If a slide consistently shows low completion across multiple investors, that’s your signal to rewrite it, not a coincidence.
Page-by-page analytics exist specifically to catch this kind of attention leak before you’ve burned through your entire investor list on a deck that loses people at the same point every time.
What Should You Say (and Not Say) in a Follow-Up?
Never quote raw engagement numbers to an investor. Referencing exact time spent on a slide comes across as surveillance, and it tends to make investors more guarded rather than more responsive. This applies even when the intent is purely to be helpful.
- Avoid: “I noticed you spent four minutes on our revenue slide.”
- Use instead: “Happy to walk through our revenue model in more detail if useful.”
- Best practice: let inferred interest shape what you send, never what you say you saw.
Keep gating light. Optional email capture before viewing is reasonable; mandatory NDAs for a first-look deck usually cost you more goodwill than they protect.
Pro Tip: Reserve a direct meeting ask for hot-tier signals only. Everyone else gets a value-add update first, since a premature meeting request can read as pressure rather than progress.
How Do You Instrument a Raise With Trackable Links?
Setting this up takes less than an hour, and it pays off on your very first round of outreach.
- Generate a unique tracked link for every investor, labeled by name, firm, and referrer.
- Route open and return-visit notifications to Slack or your calendar app so nothing sits unread.
- Set a follow-up cadence: same day for hot signals, 24 to 72 hours for warm ones, weekly check for cold ones.
- Archive the raise once closed, but keep the analytics for a post-mortem on which slides worked.
Your tracking sheet or CRM needs a minimum set of columns to be useful; consider an AI Growth & Support Platform for SaaS Companies to integrate engagement notifications and outreach efficiently.
- Investor, Firm, Referrer
- Link ID, First View Date, Total View Time
- Slides Viewed, Session Count, Shared (Y/N)
- Follow-Up Action, Outcome
Because hosted links preserve version control, updating your deck mid-raise serves the new version to every investor who already has the link, so you never have to send an awkward “ignore the last version” email. A secure data room setup can handle the access controls and watermarking piece if you’re running a larger round with more sensitive financials.
Common Pitfalls When Reading Fundraising Analytics
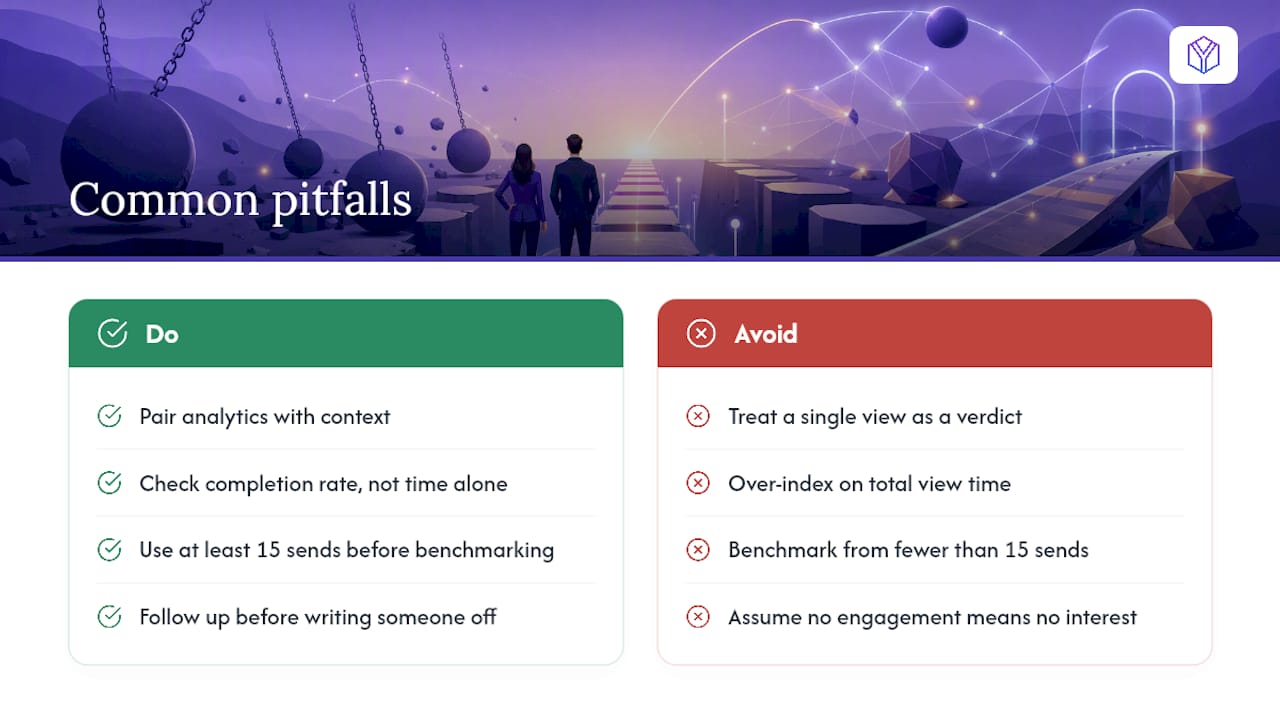
The biggest mistake founders make is treating a single data point as a verdict. One short view session doesn’t mean an investor passed. It might mean they opened the deck on a phone between meetings and plan to read it properly later that night.
Another common error is over-indexing on total view time while ignoring completion rate. An investor who spends six minutes but only reaches slide 5 out of 15 is stuck somewhere, not deeply engaged. That’s a slide problem, not a good sign.
Small sample sizes also distort interpretation badly at the pre-seed stage. If you’ve only sent your deck to eight investors, one outlier read (a partner who left the tab open overnight) can skew your sense of what “normal” engagement looks like for your raise. Don’t build benchmarks off fewer than fifteen or twenty sends.
Founders also tend to assume no engagement means no interest, when it sometimes just means a slow inbox. A cold-tier investor who suddenly returns to the deck three weeks later after a public funding announcement from a competitor is a different case entirely from one who never engaged at all. Analytics tell you what happened, not always why, so pair the data with context before deciding whether to write someone off.
Finally, watch for false positives from junior associates. A long view session from an analyst doing first-pass screening doesn’t carry the same weight as a partner returning for a second read.
Why Analytics Changed How I Think About Founder Time
The scarce resource in any raise isn’t the deck. It’s the founder’s attention, and most of it gets wasted chasing investors who already passed silently. Ranking follow-ups by actual engagement, rather than gut feel or who replied fastest to a cold email, redirects that attention toward the conversations most likely to close. The data doesn’t replace judgment. It just tells you where to point it first.
— Paul
Instrument Your Next Raise With BabyLoveRaise
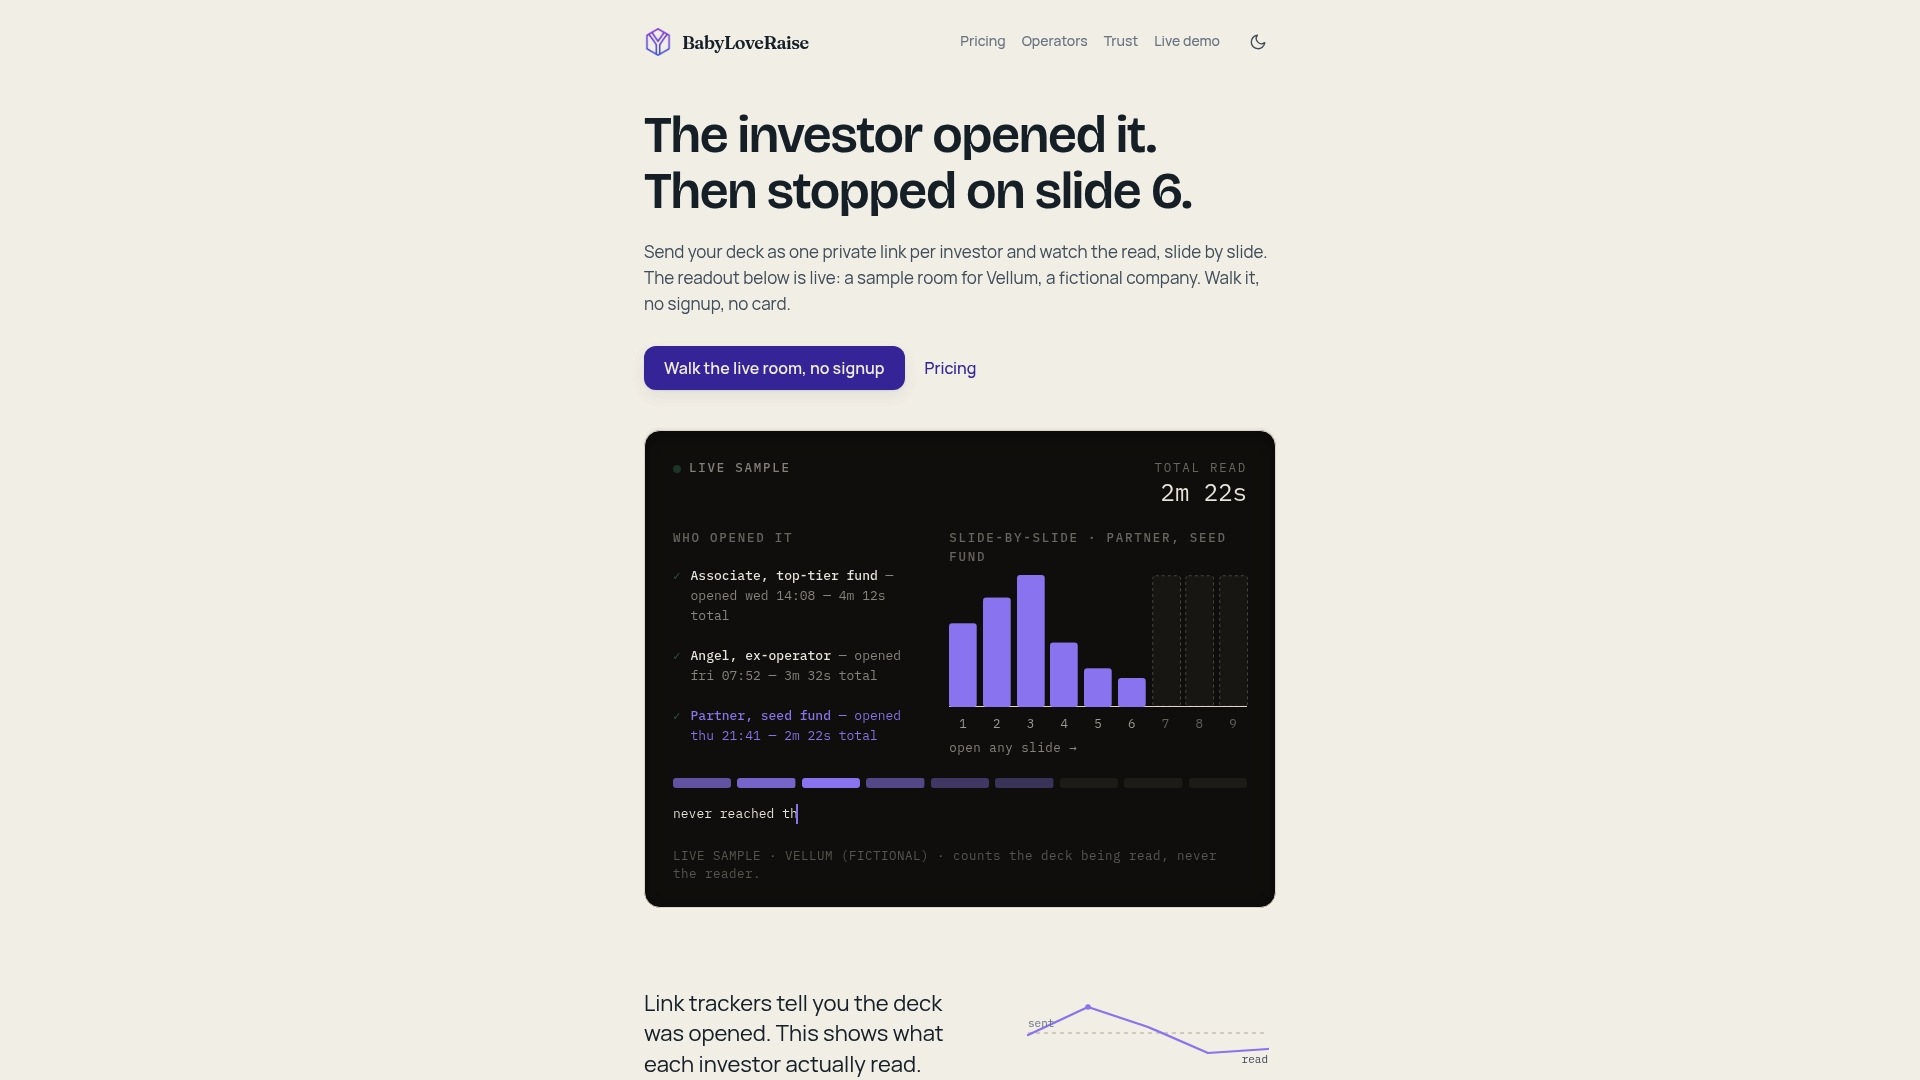
Some raise room platforms offer features such as one link per investor, real-time notifications when someone opens your deck, and per-slide attention data that shows exactly where readers stalled or sped through. Downloads can carry a measured watermark, and share links may come in different registers, such as first send, forwardable, and private, to let you monitor how a deck is moving before it reaches a partner meeting.
For fractional CFOs and advisory firms juggling several client raises at once, some platforms offer options to run firm-branded rooms across every active deal. Founders who want hands-on help tightening the deck can add concierge editorial services. Pricing may run per raise rather than per seat, and after the round closes, the room can convert into a permanent archive instead of hitting a paywall. Start a raise room at BabyLoveRaise and send your first tracked link today.
Sources
- The Founder’s Guide to Pitch Deck Analytics: How to Read Investors’ Minds
- How to Measure Investor Engagement and Close Your Round
FAQ
What Counts as Good Engagement on a Pitch Deck?
Total view time over five minutes, a completed read-through, and a return visit within a few days are strong positive signals for a pre-seed or seed deck.
How Soon Should I Follow Up After an Investor Opens My Deck?
Follow up the same day for high-engagement signals, within 24 to 72 hours for moderate engagement, and weekly for low or no engagement.
Is It Okay to Mention Tracked Engagement Data in a Follow-Up Email?
No. Referencing exact time-on-slide numbers tends to feel like surveillance; use the signal to decide what value-add content to send instead.
What’s the Difference Between a Tracked Link and Emailing a PDF?
A tracked link, like a raise room from BabyLoveRaise, shows per-slide dwell time, session counts, and return visits, while an emailed PDF gives you no visibility once it leaves your inbox.
How Many Investors Should I Track Before Trusting the Benchmarks?
Aim for at least fifteen to twenty tracked sends before drawing conclusions, since smaller samples make one outlier session look like a trend.