
PDF Page Analytics for Fundraising: A Founder's Guide
Unlock the power of pdf page analytics to boost your fundraising. Discover key signals to close deals faster and impress investors.
August 5, 2026 · 11 min read

Use a raise room with per-slide engagement tracking and first-read alerts. That’s the short answer. Founders who send a pitch deck as a raw PDF or Drive link and wait on a fixed follow-up schedule are flying blind. The ones closing meetings faster are using pitch deck PDF analytics to see exactly who opened the deck, which slides held attention, and when an investor came back for a second look. The signals that matter most: a session longer than 4 minutes, return visits within 3–7 days, and multiple viewers from the same domain within 48 hours. Those three, together, are your call list.
Act on these signals first:
-
- Multi-reads (2–3 sessions in under a week) with progressively deeper paths
-
- High dwell on traction or financials (over 20–30 seconds per slide)
-
- Same-domain forwarding detected within 48 hours of the first open
Table of Contents
- What does fundraising-focused PDF page analytics actually measure?
- What benchmarks should you use to interpret engagement?
- How do you triage and prioritize investor follow-ups?
- What are the privacy and ethics rules for US-based fundraises?
- How does pricing usually work for raise-centered analytics?
- How do founders, fractional CFOs, and advisory firms use per-slide analytics?
- What’s the recommended action plan for this week?
- Key Takeaways
- A fundraising operator’s perspective
- BabyLoveRaise gives you the raise room, not just the tracking
- Sources and further reading
What does fundraising-focused PDF page analytics actually measure?
Fundraising-specific per-slide analytics go well beyond a simple open count. Here’s what a raise-room tool captures at the session level:
- Per-slide dwell time. How long a viewer spent on each slide, measured as median seconds per slide across the session. Investors average roughly 21 seconds per slide across a deck, so anything significantly above that on traction or financials is a meaningful signal.
- Total session duration and completion rate. Whether the investor read to the last slide or dropped off at slide 4. Completion rates range between 22% and 67% depending on investor quality and stage.
- First-read alert. A real-time notification the moment a link is opened for the first time. This is distinct from subsequent reads and triggers a different follow-up response.
- Return visits and multi-read patterns. The timing and depth of second and third sessions. A second read that jumps straight to traction or financials is a stronger signal than a first read that went cover-to-cover.
- Forwarding and same-domain multi-viewer detection. When multiple viewers from the same firm open the deck within a short window, that’s internal championing in progress.
- Device and time-of-day context. A mobile open at 8 PM reads differently than a desktop session at 2 PM on a Tuesday.
- Downloads with measured watermarking. Tracks which version was downloaded and by whom, without blocking access.
- Versioned-deck comparisons. Side-by-side drop-off data across deck iterations, so you can see whether a revised traction slide actually held attention longer.
For a deeper look at which slides to build into your pitch deck, slide order matters as much as content density.
What benchmarks should you use to interpret engagement?
Industry benchmark data drawn from 10,000+ investor sessions puts the average session at roughly 2 minutes 24 seconds to 3 minutes 21 seconds. Longer sessions are typically indicative of high intent. Seed-stage decks often get less time than later-stage ones, which makes per-slide efficiency even more critical. Investors average between 22% and 67% completion rates depending on quality and stage.

| Signal | Threshold | What it likely means |
|---|---|---|
| Total session duration | Under 2 min | Quick scan; low intent |
| Total session duration | 2 min 24 sec – 3 min 21 sec | Average engagement |
| Total session duration | Over 4 min | High intent; prioritize follow-up |
| Per-slide dwell (traction/financials) | Over 20–30 seconds | Investor is scrutinizing the numbers |
| Return visits | 2–3 reads in 3–7 days | Strong buying signal |
| Same-domain viewers | 2+ within 48 hours | Internal forwarding; partner meeting likely |
Traction and financial slides consistently draw the longest dwell time (typically over 20–30 seconds per slide) and the most return-visit attention. Placing a traction snapshot early, on pages 2–3, tends to anchor interest before an investor decides whether to keep reading.
The most reliable read of intent comes from combining signals. A 5-minute session with no return visit is interesting. A 3-minute session followed by a second read that goes straight to financials, plus a second viewer from the same domain two days later, is a meeting request waiting to happen.
Mobile sessions tend to be faster and shallower. A short mobile open followed by a longer desktop session the next day is a pattern worth watching, not dismissing.
How do you triage and prioritize investor follow-ups?
Apply a simple point-based rubric to every session. Score each investor contact and follow up in tier order.
- First-read completed (read to last slide): +2 points
- Long session duration: +2 points
- High dwell on traction or financials (20+ seconds per slide): +2 points
- Return visit within 7 days: +3 points
- Internal forwarding detected (2+ viewers, same domain, within 48 hours): +4 points
Tier 1 (highest scoring): Follow up promptly, ideally within 24 hours. Send a short, specific note referencing the content area they spent time on, not the fact that you tracked them. Something like: “Wanted to share a one-page unit-economics summary in case it’s useful for your diligence.”
Tier 2 (moderate scoring): Personalized follow-up within a few days. Reference the deck, offer a call, and attach a relevant data room link or supporting document.
Tier 3 (lower scoring): Add to automated nurture sequence. Add to a low-touch sequence. Don’t burn personal outreach on a cold signal.
For investor follow-up templates and timing guidance tied to these tiers, BabyLoveRaise’s blog covers the full outreach cadence.
To wire this into your CRM, most raise-room tools support webhooks or Zapier connections. A first-read alert triggers a task creation in HubSpot or Notion; a return-visit event bumps the contact’s score automatically.
Pro Tip: When referencing slide-level data in outreach, always frame it as content context, never surveillance. “Thought you might want more detail on our retention numbers” lands well. “I saw you spent 47 seconds on slide 9” does not.
What are the privacy and ethics rules for US-based fundraises?
The core design principle: track the document and the session, not the person’s browsing behavior. A raise-room tool should report on how a shared document was engaged with, not build a profile of the individual investor.
For US-based fundraises, a few practical guardrails apply:
- Avoid publicly sharing or publishing individual investor engagement data.
- Don’t reference exact timestamps or slide numbers in outreach. Use content context instead.
- Apply domain filters to exclude your own team’s opens from session counts.
- Set a data retention policy for session logs. Ninety days is a reasonable default for most raises.
- Offer an opt-out or unsubscribe path on shared links where appropriate.
Pitch deck tracking that reports on document engagement, not individual behavior, sits comfortably within standard US business communication norms. The line is crossed when tracking data is used to profile, pressure, or publicly expose an investor’s reading behavior. Keep it internal, keep it contextual, and use it to improve your outreach, not to demonstrate surveillance.
For a deeper look at privacy-first tracking principles in practice, BabyLoveRaise’s approach to document-level reporting is worth reading before you configure your room.
How does pricing usually work for raise-centered analytics?
Pricing shapes vary by who’s buying and how many raises they’re running simultaneously.
- Per-raise flat fee. Best for solo founders running a single seed or pre-seed round. You pay for one room, one raise, and the room converts to a free archive when the round closes. No ongoing seat cost.
- Monthly or quarterly subscription. Useful for founders who run multiple rounds or want continuous access to analytics between raises.
- Operator console or white-label plan. Built for fractional CFOs and advisory firms managing several client raises at once. Firm-branded rooms, consolidated dashboards, and per-client reporting at a fraction of virtual-data-room pricing.
- Bundled concierge services. Some platforms offer editorial passes or narrative build artifacts alongside the analytics room. Worth evaluating if your deck needs structural work before you start tracking.
For advisors: the operator tier pays for itself quickly when you’re running three or more simultaneous client raises. The alternative, paying per-raise across each client, adds up fast. For solo founders, per-raise pricing avoids the trap of paying for a seat you’ll use for six weeks and then abandon.
ROI is straightforward to calculate: how many hours per week do you spend manually triaging investor follow-ups? A raise room with automated scoring and first-read alerts typically cuts that to under 30 minutes a day.
How do founders, fractional CFOs, and advisory firms use per-slide analytics?
Three scenarios where the data changes the workflow:
| Persona | Trigger | Action |
|---|---|---|
| Solo founder, seed raise | First-read alert fires at 9 AM | Send Tier 1 follow-up by noon; attach unit-economics one-pager |
| Fractional CFO, 3 client raises | Same-domain forwarding on Client B’s deck | Flag to client; prepare partner-meeting materials |
| Advisory firm | Slide drop-off rate spikes across version A | Revise traction slide in version B; compare dwell data after 20 sessions |
Workflow checklist (copy this):
- Upload final deck version and enable session tracking in your raise room.
- Send share links using the appropriate register (first-send, forwardable, or private).
- Score each session against the rubric within 24 hours of the first-read alert.
- Follow up in tier order. Tier 1 same day, Tier 2 within 72 hours.
- After 20+ sessions, review per-slide drop-off data and refine your deck before the next send wave.
Founders who A/B test deck versions and track drop-off changes across iterations see measurable improvements in read-through rates. Version B doesn’t need to be a full redesign. Moving traction to slide 2 and watching whether completion rates shift is a one-hour experiment with real data behind it.
What’s the recommended action plan for this week?
Use a raise room with per-slide analytics and first-read alerts. That’s the verdict. Here’s how to run it in five steps:
- Prepare your deck version. Lock a clean PDF. Note which slides carry traction and financial data.
- Enable session tracking. Set up your raise room, configure share link types, and test the first-read alert.
- Set scoring thresholds. Apply the rubric above. Decide your Tier 1 and Tier 2 cutoffs before the first link goes out.
- Integrate with your CRM. Connect via webhook or Zapier so first-read alerts auto-create follow-up tasks.
- Schedule your outreach cadence. Tier 1 within 24 hours, Tier 2 within 72 hours, Tier 3 into nurture.
One privacy reminder: reference slide content in outreach, never the fact that you tracked the session.
Key Takeaways
Per-slide dwell time combined with return visits and forwarding detection is the most reliable way to rank investor follow-ups during a live raise.
| Point | Details |
|---|---|
| High-intent threshold | Sessions over 4 minutes and 2–3 return visits in 3–7 days are your strongest follow-up signals. |
| Slide-level priorities | Traction and financial slides averaging over 20–30 seconds of dwell time indicate real scrutiny. |
| Forwarding beats view count | Multiple viewers from the same domain within 48 hours predicts a partner meeting better than raw opens. |
| Privacy guardrail | Track the document and session, not the individual; never reference exact timestamps in outreach. |
| BabyLoveRaise | Offers per-raise pricing, per-slide dwell analytics, first-read alerts, and an Operator tier for advisory firms. |
A fundraising operator’s perspective
The metric most founders fixate on is the open count. It’s the wrong number. What actually changes your week is the second read, specifically where it starts. An investor who opens your deck cold and reads cover-to-cover is curious. An investor who comes back three days later and jumps straight to your financials is doing diligence.
The forwarding signal is even more underrated. When two people from the same firm open the same link within a day of each other, that’s not a coincidence. That’s an internal conversation happening without you in the room. The right move isn’t to reference the tracking in your outreach. It’s to send the partner-meeting prep materials before they ask for them.
The founders I’ve seen use analytics well treat it as triage, not a crystal ball. They’re not trying to read investor psychology from a 90-second session. They’re sorting a list of 40 contacts into three buckets and spending their energy on the top ten. That discipline, more than any single metric, is what keeps a raise moving.
BabyLoveRaise gives you the raise room, not just the tracking
Most pitch deck PDF analytics tools were built for sales teams. BabyLoveRaise was built for a raise. The difference shows up in the details: per-raise pricing instead of a perpetual seat, a first-read alert that fires the moment an investor opens your link, and a dashboard that separates “never opened” from “read everything and passed” so your follow-up list is actually sorted.
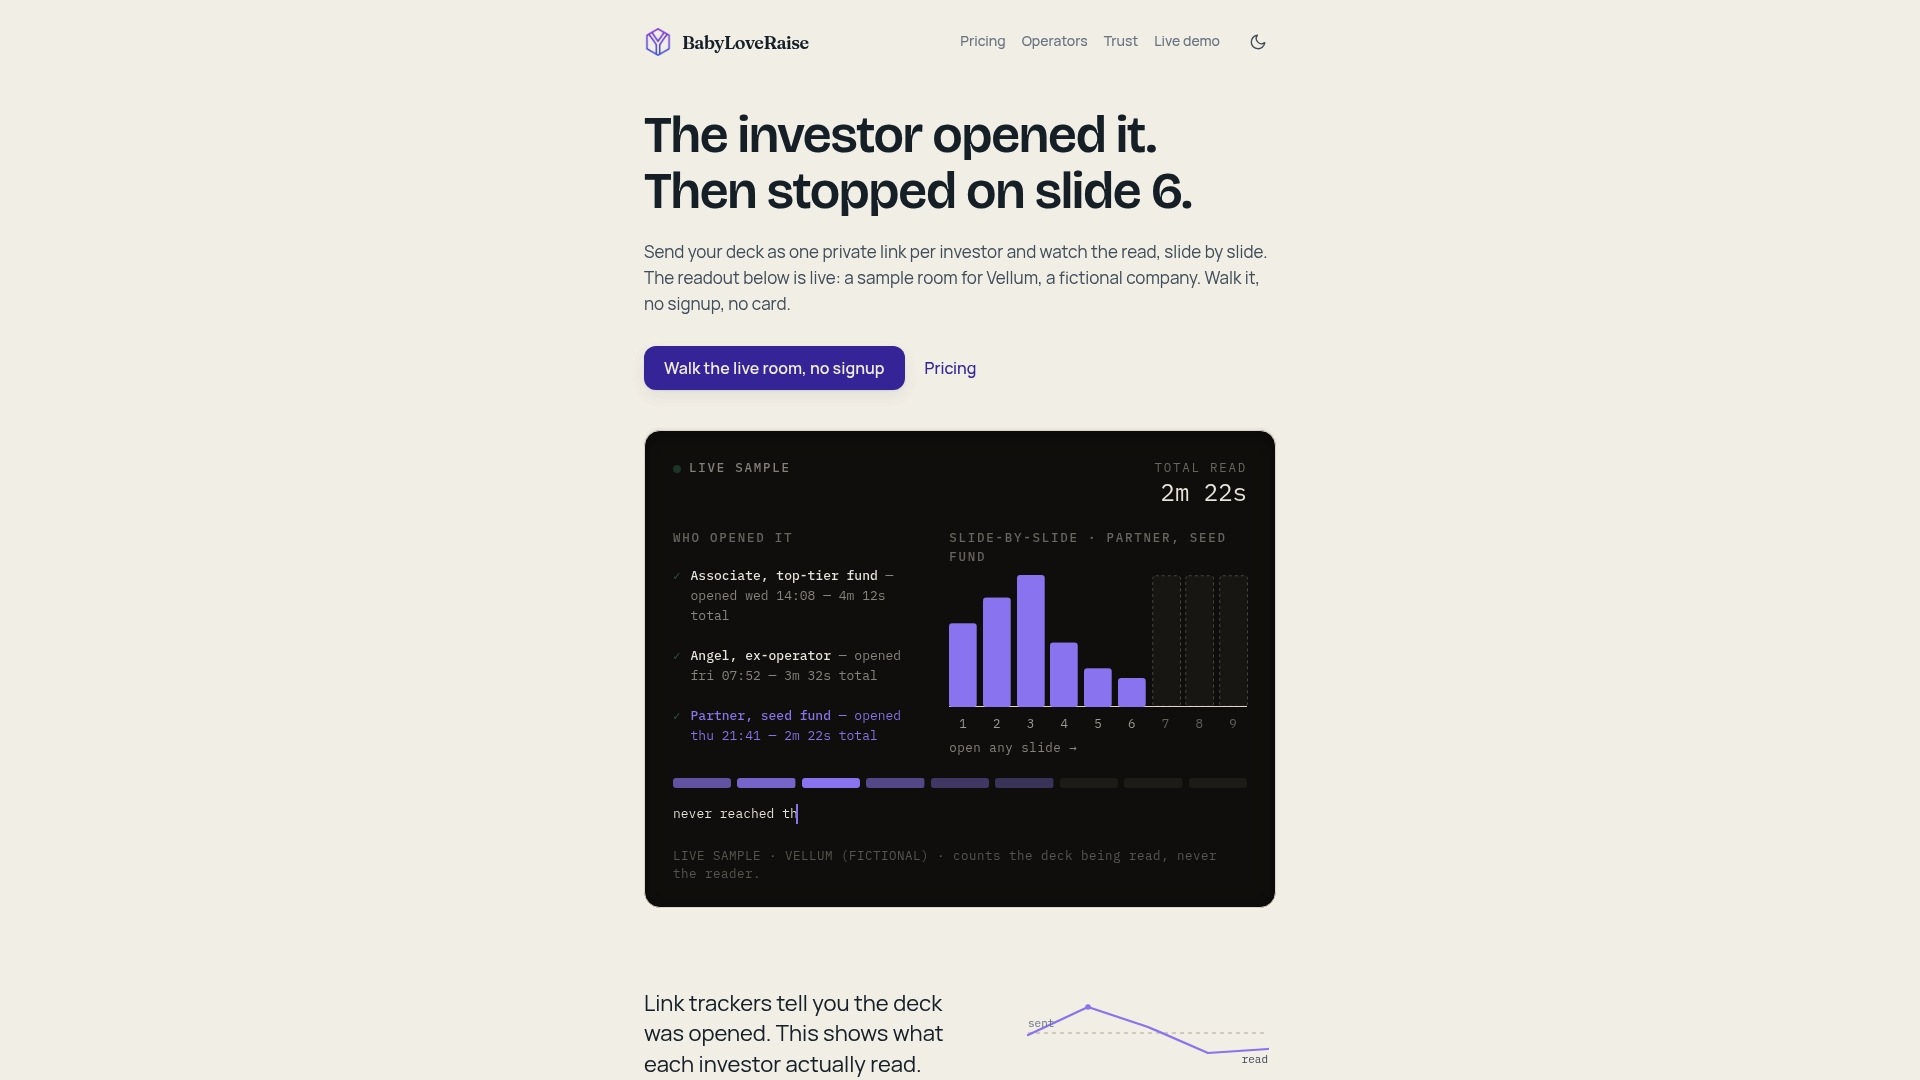
For advisory firms and fractional CFOs, the Operator tier runs firm-branded rooms across multiple client raises from a single console, at a cost that makes virtual-data-room pricing look hard to justify. Optional concierge editorial passes cover founders who want a narrative review before the deck goes live.
The raise room converts to a free permanent archive when the round closes. No paywall, no data hostage situation.
See pricing and plans and set up your raise room before the next link goes out.
Sources and further reading
| Source | What it covers |
|---|---|
| Pitch Deck Analytics: Benchmark Report | Session duration benchmarks, per-slide dwell averages, multi-read patterns |
| Per-Slide Analytics — Visible.vc | Slide-level dwell data and session-level metric definitions |
| What Presentation Analytics Track Investor Engagement | Six core metrics and forwarding as a predictor of follow-up |
| The Only Pitch Deck Analytics That Actually Matter | A/B testing deck versions and drop-off optimization |
| Pitch Deck Traction Slide That Gets Funded — VentureMage | Traction slide benchmarks and average time-per-slide data |
| BabyLoveRaise Blog | Founder guides on deck strategy, investor follow-up, and raise-room workflows |
| BabyLoveRaise Pricing | Per-raise, subscription, and Operator console plan details |