
Pitch Deck Engagement Metrics: What to Show and Track
Pitch deck engagement metrics come in two kinds: the traction numbers inside your deck and the reading signals investors leave. Here is what each tells you.
November 1, 2026 · 11 min read

“Pitch deck engagement metrics” means two different things, and a founder raising pre-seed or seed money needs both. The first is the product engagement you put inside the deck: activation, retention, repeat usage, waitlist growth. The second is how investors engage with the deck itself: who opened it, how far they read, which slides held them. The first decides whether an investor believes you. The second tells you whom to call, and which slides to rewrite.
This guide covers both, with definitions you can use this week and the limits of each number.
BabyLoveRaisebabyloveraise.comSee How Investors Read Your DeckBabyLoveRaise tracks first opens, completion, and per-slide engagement, helping you focus follow-ups and revisions on what readers actually saw.Explore deck engagement trackingTL;DR
- Inside the deck, show the one engagement metric that is the heartbeat of your business, with a cohort view, labeled actual or projected.
- Retention and activation beat sign-ups and traffic. Top-of-funnel numbers only count if they convert.
- Outside the deck, track four things: first open, completion, per-slide time, and forwards. Together they separate “never opened” from “read it and passed.”
- Reading data describes the document, not the investor’s intent. Use it to prioritize follow-ups and revisions, never to guess a decision.
- Keep the main deck short and push detail to an appendix or data room.
Table of Contents
- Two kinds of deck engagement metrics
- Engagement metrics to put inside your pitch deck
- Engagement metrics about the deck itself
- Turn the signals into actions
- A worked example
- Perspective
- Run your raise with per-slide signals
- FAQ
- Sources
Two kinds of deck engagement metrics
It helps to keep the two families apart, because they answer different questions and come from different places.
| Metrics inside the deck | Metrics about the deck | |
|---|---|---|
| Question | Does the product hold users? | Are investors reading the deck? |
| Source | Your product data, billing, pilots | Your deck-sharing tool |
| Audience | The investor deciding whether to meet | You, deciding what to do next |
| Examples | Retention cohorts, activation, DAU/MAU, waitlist conversion | First open, completion, per-slide dwell, forwards |
| Risk | Vanity numbers, cherry-picked cohorts | Over-reading a signal as intent |
Most articles on this topic cover only the left column. Founders who send a PDF and wait have nothing in the right column at all, which is why a quiet inbox is so hard to interpret.
Engagement metrics to put inside your pitch deck
At pre-seed and seed, nobody expects a mature metrics dashboard. They expect evidence that real people use the thing and come back. Guidance for pre-seed founders lists DAU/MAU, activation, waitlist growth, pilot programs, letters of intent and any early revenue as credible ways to show traction when revenue is thin.
A16z’s guide to data rooms points the same way: founders should include usage data on growth, acquisition channels and costs, engagement, and retention, and consumer companies may add LTV/CAC and payback period.
Pick the heartbeat metric
There is no universal chart. NextView Ventures makes the point that no single proof point fits every company, so you choose the best way to show your company is working. First Round Review frames it as finding the metric that represents the heartbeat of your business.
A practical way to choose:
- Name the single action that means a user got value (a report sent, a booking completed, a file shared).
- Count how many new users do it in their first week. That is activation.
- Count how many of them do it again in weeks two, four and eight. That is retention.
- Put that one line on the traction slide and explain it in one sentence.
A B2B tool might lead with weekly active teams. A marketplace might lead with repeat transactions per buyer. A pre-launch product might lead with waitlist-to-pilot conversion. The metric changes by model, the logic does not.
Show retention as a cohort curve
An average retention number hides what investors want to see. A cohort view tracks users who started in a given month and follows them over time, and a curve that flattens means users are being retained. A curve that keeps sliding toward zero says the opposite, however fast sign-ups grow.
Sequoia describes sustainable growth as high retention plus a quick ratio above 1. The quick ratio is new users plus resurrected users, divided by churned users. If you add 300 new and 50 resurrected users in a month and lose 200, your quick ratio is 1.75. Sequoia’s warning is that growth without retention is a leaky bucket, and you should be able to explain not just how you acquire users but how you keep their value.

Skip the vanity numbers
Email sign-ups, website traffic and social followers that never turn into revenue are red flags rather than traction. The fix is to show the conversion: visitors to sign-ups, sign-ups to activated users, activated users to paying customers. If you want a framework for judging whether top-of-funnel interest becomes real usage, this guide to measuring KPIs walks through the funnel logic.

Label everything and show the full cohort
Investors compare your deck to your model. A16z advises marking each figure as actual (A) or projected (P) so one mislabeled number does not cost you credibility, and presenting full cohort data instead of the best-looking slice, because investors scrutinize retention as a predictor of long-term health.
If you are choosing which financial and usage metrics deserve a place in the deck, this overview of SaaS metrics that matter is a useful companion for the finance side.
Adjust by stage
| Stage | What counts as engagement evidence |
|---|---|
| Idea or pre-launch | Waitlist size and conversion, interviews, signed LOIs |
| Pre-seed with early users | Activation rate, week-4 retention, pilot usage depth |
| Seed with revenue | Cohort retention, net revenue retention, payback, MRR growth |
Pre-revenue startups can show traction through users, engagement, pilots or waitlists. Many early teams have no MRR at all: in one founder dataset, roughly 95% of startups did not report MRR. Do not apologize for that. Show the engagement you do have, clearly defined.
Engagement metrics about the deck itself
Now the other side. When you send a deck as an attachment, you learn almost nothing. A hosted link changes that, and the useful signals are few.
The four signals worth tracking
- First open. The moment someone actually looked, which is the best time to follow up if you have a reason to.
- Completion. Whether they reached the last slide. A reader who gets to the ask has seen your whole case.
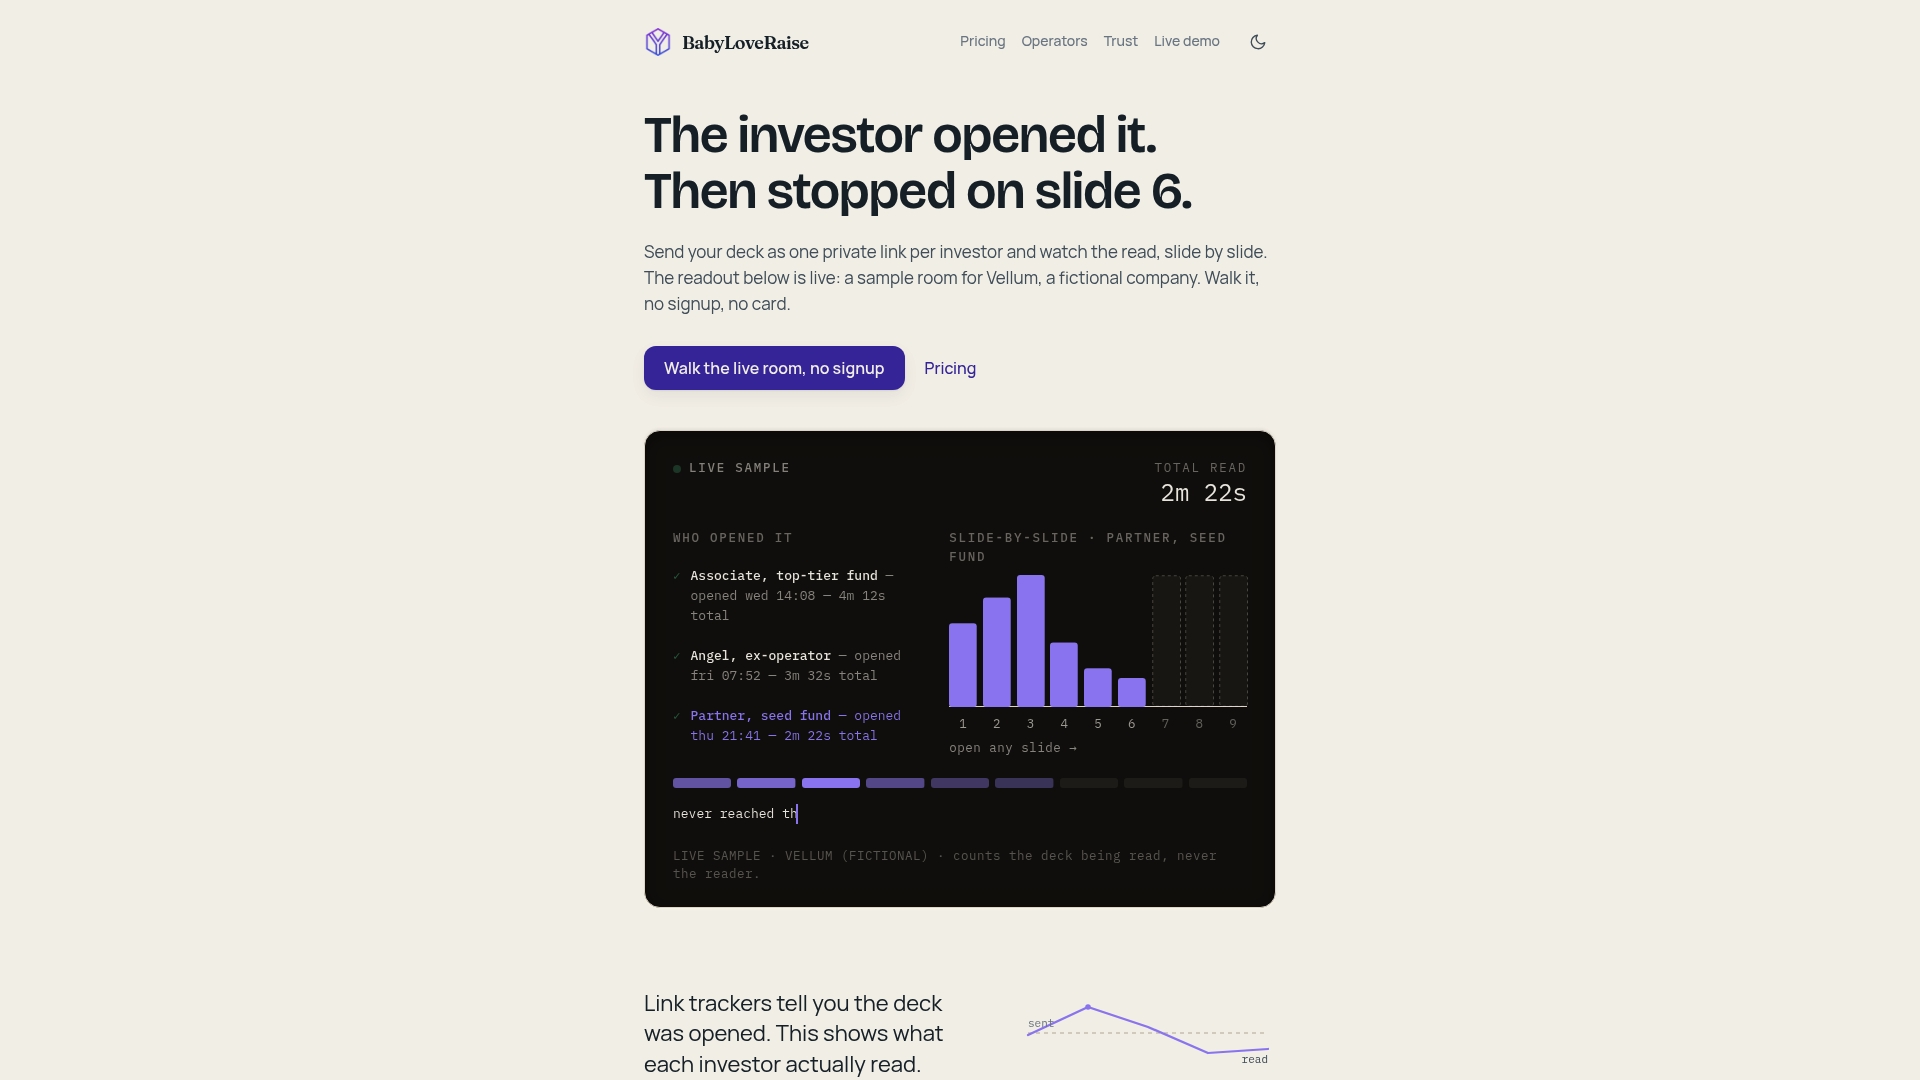
- Per-slide time. Where attention held and where it was skimmed. This is the closest thing a solo founder has to a cofounder’s read of the deck.
- Forwards and new viewers. A deck that moves from one partner to a colleague has usually cleared a first bar.
Together these split two situations that look identical in an inbox: “never opened it” and “read everything and passed.” The first calls for a different channel or a nudge. The second calls for a question about why, or a revision of the slide where attention died.
What the research says about attention
Deck-sharing research reviewed by TechCrunch suggests the company purpose slide acts as a gatekeeper, with investors deciding in a single glance whether the business merits further review. The same piece quotes the research lead saying investors spend less time per deck as links multiply, so founders should communicate briefly and specifically.
The practical consequence: your first two or three slides carry disproportionate weight, and per-slide data is how you check whether yours do their job.
What deck analytics cannot tell you
This is where founders go wrong. Reading data describes what happened to a document. It does not describe why.
- A short visit can mean disinterest, or an investor who already knew your space and went straight to the traction slide.
- A long dwell on one slide can mean fascination, or confusion about a confusing chart.
- A forward can be a recommendation or a request for a second opinion that ends in a pass.
- Missing data can mean the person read on a phone, offline, or from a forwarded copy.
Treat each signal as a prompt for a decision, not a verdict. We also think the tracking should be honest: reporting on how the document performs, not building a profile of the person. Our note on tracking without turning investors into profiles explains where we draw that line.
Turn the signals into actions
Numbers only matter if they change what you do next. A simple decision table:
| What you see | Likely reading | What to do |
|---|---|---|
| Not opened after several days | Missed, buried, or wrong channel | Resend through a different route, or ask your intro source to nudge |
| Opened, left in the first slides | The opening did not earn the next click | Test a sharper purpose slide, and look at the order of slides |
| Read to the end, quick pass | Possible fit problem or a missing proof point | Ask for one line of feedback, note the slide that held longest |
| Long time on traction or financials | Real scrutiny | Offer the data room or a metrics walkthrough |
| Forwarded to a new viewer | Internal interest | Follow up within the day, with a short note |
Across a whole raise, the pattern across many readers matters more than any one reader. If most of them stall on the same slide, that slide is the problem, and you can revise it between send batches. Our guide on deck engagement metrics that tell you who to call next goes deeper on the follow-up side, and how to track investor engagement covers setup.
Keep the deck short, push detail back
One approach is a main deck of 12 to 15 slides with a separate 20 to 40 slide appendix for the data room. That separation also makes your analytics cleaner: you can see whether people who finished the main deck went on to open the detail. If you are unsure of the order, start from an investor-focused slide order.
Use different links for different sends
A first send to a cold contact, a link meant to be forwarded, and a private link for a lead investor are different situations. Separate links per context keep your data readable, so a forward from a partner is not mixed in with first-time opens from a mass send. For control over who can see what, see how to set up deck access control.
A worked example
Say you send a seed deck to 30 investors over two weeks.
- 22 open it. Eight never do. Those eight get a new approach, not a repeat of the same email.
- Of the 22, 12 reach the last slide. Ten leave early, and most of those exits are on slide 4, the market-size slide.
- Among the 12 who finished, 5 spend the most time on the traction slide. Those five go to the top of your call list, with an offer to walk through the cohort data.
- You rewrite slide 4 to lead with a bottoms-up number, and the next batch of 10 sends shows fewer exits there.
The numbers here are illustrative, not benchmarks. The point is the workflow: classify readers, call the right ones, revise the slide that loses people.
Perspective
We built BabyLoveRaise around one observation: a founder raising money has no cofounder reading over their shoulder, and an emailed PDF gives no feedback at all. Per-slide dwell is the next best thing. It will not tell you what an investor thinks, but it will show you where the deck lost them.
We also think the two silences should never look the same. “Never opened” and “read it all and passed” need different responses, and most founders treat them identically because their tools cannot tell them apart.
Finally, we price per raise, not per seat forever, and when the raise closes the room becomes a free permanent archive. Deck analytics should serve the raise, not outlast it as a subscription you forgot about.
Paul
Run your raise with per-slide signals
If you are about to send your deck, we built the raise room for exactly this: one link, a notification on first read, per-slide engagement, and a view of who finished the deck. The raise room is $399 per quarter or $149 per month on our pricing page, and the draft room and editorial pass are listed there too.
Advisors and fractional CFOs who run several client raises can look at the Operator seat plans, at $399 per month per seat or $3,990 per year per seat. For how we handle tracking and data, see our trust page.
FAQ
What are the most important pitch deck metrics for a seed round?
Pick the one engagement metric that best proves people use and keep using your product, then support it with retention cohorts and conversion from sign-up to activation. Add revenue, pilots or LOIs if you have them. Label every number as actual or projected.
How much time do investors spend on a pitch deck?
Less than founders hope, and it has been falling as decks pile up. Published research describes investors deciding quickly on the company purpose slide and spending less per deck as links multiply. Because averages vary by source and year, track your own readers’ per-slide time instead of leaning on one headline figure.
Can deck analytics tell me whether an investor will invest?
No. They show opens, completion, time per slide and forwards, which describe how the document was read. Use them to decide whom to follow up with and which slides to revise, and ask the investor directly where they stand.
Is it fine to use user growth if I have no revenue?
Yes, if the growth connects to engagement. Waitlist conversion, activation, retention and pilot usage all work at pre-revenue stages. Raw sign-ups and traffic that never convert tend to read as vanity metrics.
Should I send one link to every investor?
It is better to use a separate link for each context, such as a first send, a forwardable version and a private one. That keeps the data readable and lets you control access. Our deck analytics guide shows how founders structure this.
Sources
- How to Show Traction for Pre-Seed Startup, Flowjam
- The Insider’s Guide to Data Rooms, a16z
- Pitch Deck Month: Is It Working?, NextView Ventures
- ClassPass’ Founder on Marketplace Product-Market Fit, First Round Review
- How to turn user data into your next pitch deck, TechCrunch
- Sustainable Product Growth, Sequoia Capital
- Banish vanity metrics from your startup’s pitch deck, TechCrunch
- Looking at 320 pitch decks, TechCrunch
- How to Build the Perfect Pitch Deck Traction Slide, PitchGrade
- The Founder Files, Sequel
- How Long Should a VC Pitch Deck Be, Funding Blueprint
- SaaS Metrics: The Ones That Matter
- How to measure website success: KPIs