
Slide Dwell Time: Benchmarks and Playbook for Founders
Discover how measuring slide dwell time can transform your pitch effectiveness. Learn benchmarks and tools to engage investors better.
August 16, 2026 · 10 min read

Slide dwell time is the per-investor, per-slide reading time recorded for each viewer in your pitch deck. Before you send a single cold email or tweak one bullet point, instrument that metric. Without per-investor, per-slide timestamps, you cannot tell whether an investor never opened the deck or read every slide and passed. Those two silences look identical in your inbox and require completely different responses.
Three tools handle this measurement well for active raises:
- BabyLoveRaise — a raise-room built specifically for per-investor, per-slide analytics, first-read notifications, and share-link management across warm and cold outreach
- DocSend — the source of the most widely cited investor-attention benchmarks, including the 3-minute 44-second average first-read time
- PitchGrade — publishes DocSend-derived analyses that translate raw engagement data into slide-level interpretation guidance
Key Takeaways
Per-investor, per-slide dwell time is the single most useful signal in a fundraise — instrument it before outreach, use it to fix the first three slides, and let re-read events drive your follow-up timing.
| Point | Details |
|---|---|
| Instrument before outreach | Create one unique tracked link per investor before sending a single email. |
| Fix slides 1–3 first | Problem under 20 seconds and solution under 30 seconds are the highest-leverage edits. |
| Follow up on re-reads fast | Investors who re-open within 48 hours are your warmest leads — contact them within 24 hours. |
| Run a two-week sprint | Change one slide variable, test on a small sample, and compare dwell time and meeting conversion. |
| Use BabyLoveRaise | A raise-room built for per-investor, per-slide analytics, first-read notifications, and privacy-preserving tracking. |
Table of Contents
- What slide dwell time actually measures in a fundraise
- Investor attention benchmarks every founder should memorize
- How to measure per-slide dwell time during a raise
- How to read slide signals and fix the right things first
- Using dwell-time signals to sequence follow-ups
- Two-week sprint checklist to improve your metrics
- How a raise-room solves the two silences
- What the silence in your inbox is actually telling you
- BabyLoveRaise: a raise-room built for this
- Sources
What slide dwell time actually measures in a fundraise
Slide dwell time is not the same metric web analysts track when they measure how long a visitor stays on a page. For a pitch deck, it is the per-slide duration recorded for a specific investor during a specific viewing session, captured by a tracked share link or raise-room.
The metric is composed of several distinct events:
- First-read timestamp — the exact moment a specific investor opened the deck for the first time
- Per-slide duration — seconds spent on each slide during that session
- Re-reads — subsequent sessions by the same viewer, which signal elevated interest
- Total deck time — the sum of per-slide durations for one session
- Share and forward events — whether the investor forwarded the link to a partner or associate
What slide dwell time does not cover in this context: autoplay carousel timing, LinkedIn slideshow metrics, or any general web-page engagement measurement. Those are different metrics for different audiences.
On privacy: the right approach tracks document events, not investor profiles. BabyLoveRaise is built around this distinction — the pitch deck tracking without surveillance post explains the framework in detail. You are measuring how your document performs, not building a behavioral dossier on a person.
Pro Tip: Create a separate share link for each investor or investor group. Pooled links make per-investor attribution impossible and destroy the signal you need most.
Investor attention benchmarks every founder should memorize
The headline number from DocSend-derived analysis: the average investor first-read time for a pitch deck is 3 minutes 44 seconds. That is the entire budget. Every slide competes for a share of it.
3 minutes 44 seconds — the average time an investor spends on a pitch deck during the first read. Optimize every slide for that window, not for a 30-minute meeting.
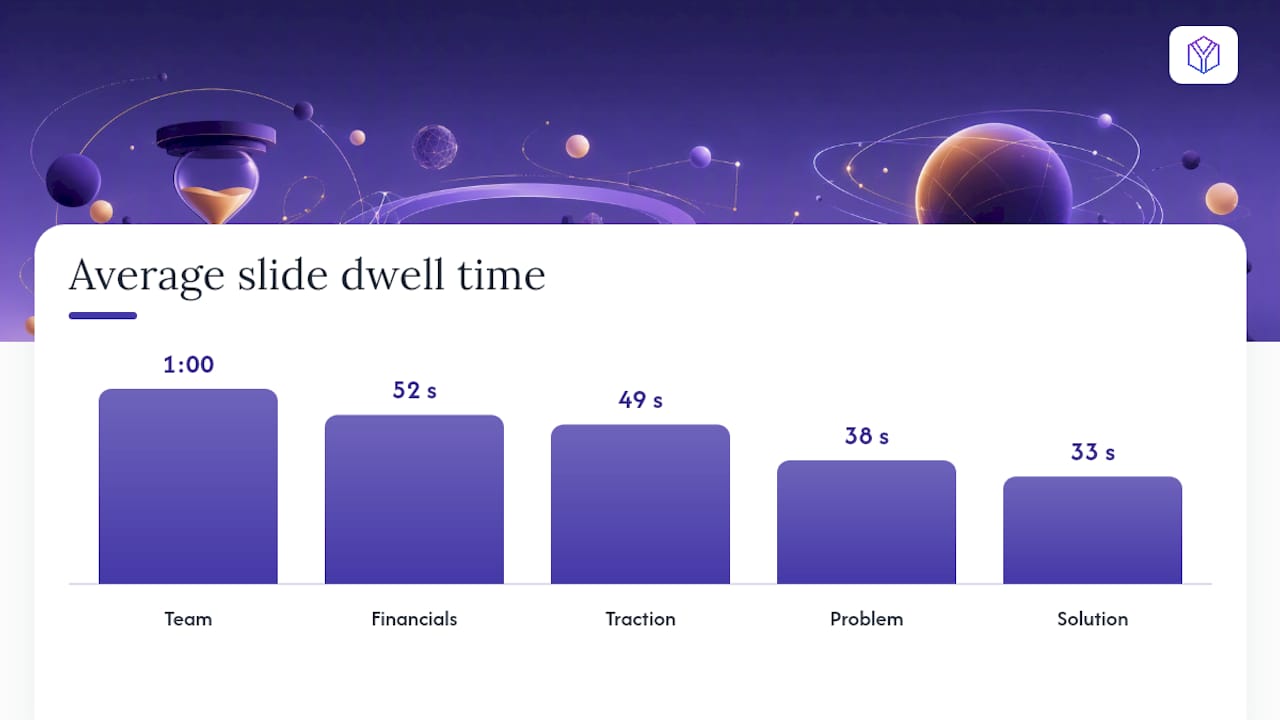
Per-slide averages from the same DocSend data break down as follows:
| Slide | Average Dwell Time |
|---|---|
| Team | 1 minute |
| Financials | 52 seconds |
| Traction | 49 seconds |
| Problem | 38 seconds |
| Solution | 33 seconds |
| Business model | 30 seconds |
| Market size | 27 seconds |
| Competition | 22 seconds |
| Product | 21 seconds |
Cold decks have shorter average reading times and lower meeting conversion rates than warm decks, which have longer average reading times and substantially higher conversion rates. The gap is not subtle.
One finding from a Goodmunity analysis of 150 funded seed decks stands out: the “Why Now” slide consistently receives notably more investor attention than many other slides, more than the problem slide and nearly as much as traction. Funded decks consistently included a dedicated “Why Now” slide that anchored the timing argument with a regulatory shift, behavioral change, or technology inflection point.
How to measure per-slide dwell time during a raise
Getting reliable data requires a deliberate setup before outreach begins. Sloppy instrumentation produces noise, not signal.
- Choose a raise-room or tracked share link. A raise-room like BabyLoveRaise records per-investor, per-slide timestamps natively. A general document tracker can work if it supports per-viewer, per-slide reporting — confirm that before you rely on it.
- Create one unique link per investor or firm. Never send the same link to multiple investors. Attribution breaks immediately.
- Enable first-read notifications. You want to know within minutes when an investor opens the deck so your follow-up timing is based on real behavior, not a guess.
- Define your measurement rules upfront. Count only the first-read session for funnel signals. Log re-reads separately as intent signals. Set a minimum threshold — sessions under 10 seconds are likely accidental opens and should be excluded from your averages.
- Build a per-investor reporting view. Each row is one investor. Columns: first-read timestamp, total deck time, per-slide dwell times, re-read count, share/forward events. A simple spreadsheet works. Treating the raise as a funnel with tracked conversion metrics at each stage — email open, deck click, deck view time, meeting booked — is the framework that separates founders who close rounds from those who run out of runway guessing.
- Segment warm vs. cold outreach. Benchmark cold sends against the 2:31 average and warm sends against the 4:18 average. Mixing them produces a meaningless blended number.
Pro Tip: Export your per-investor data weekly into a simple spreadsheet and sort by total deck time descending. The investors worth calling this week are usually in the top five rows.
How to read slide signals and fix the right things first
Short dwell time on the cover, problem, or solution slides is the most expensive problem in a pitch deck. Investors who make it past the first three slides are dramatically more likely to finish the deck — those slides function as a filter, not a warm-up. If your problem slide is getting under 20 seconds, the investor is not understanding the problem fast enough to care about the solution.
Slide-by-slide priorities:
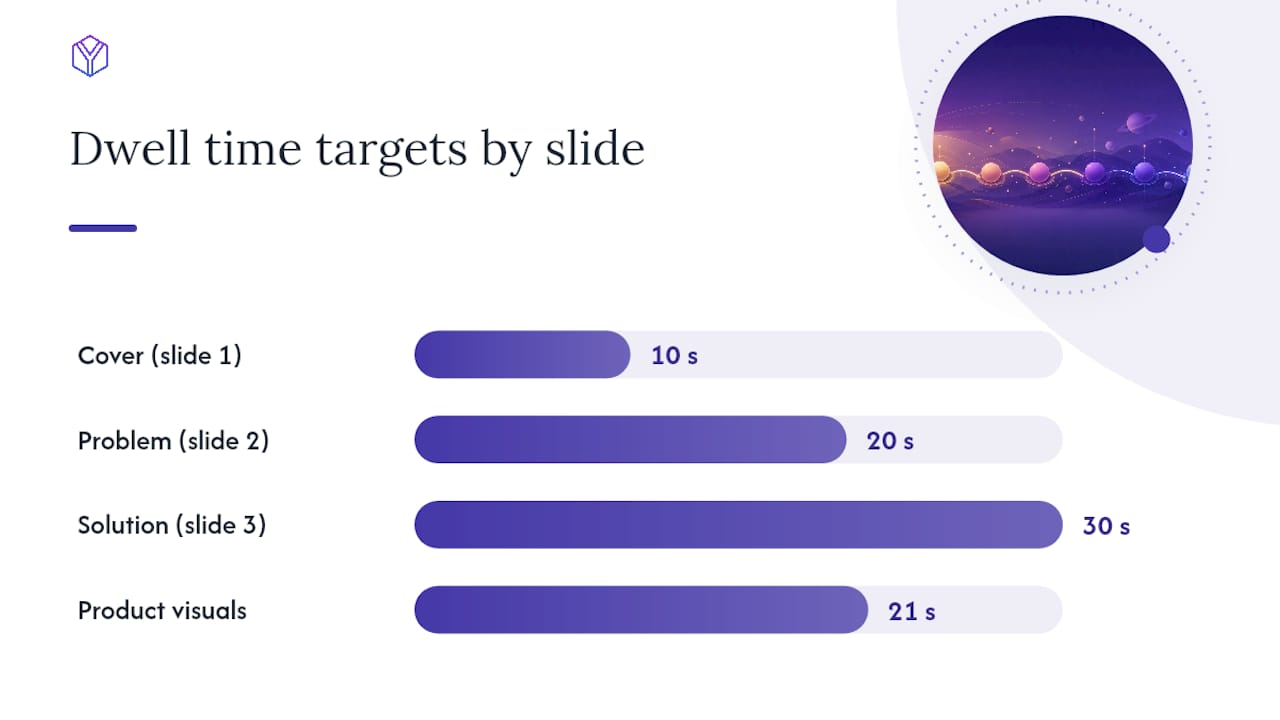
- Cover (slide 1): One sentence. Company name, what you do, and for whom. If an investor spends under 10 seconds here, the hook failed.
- Problem (slide 2): Communicate the problem in roughly 20 seconds of reading time. One sharp statistic or vivid scenario beats three bullet points.
- Solution (slide 3): Roughly 30 seconds. One clear mechanism. No feature lists.
- Market and business model: Make charts scannable. Axes first, then data. Investors extract numbers faster from a clean chart than from a table.
- Team: Highlight roles and one credibility signal per person. Long dwell here is good — it means the investor is reading carefully, not skimming.
- Financials: One page, credible assumptions, no hockey sticks without a driver. Long dwell on financials often means the investor is stress-testing your numbers, which is a positive signal worth preparing for in the follow-up.
- Product visuals: The product slide gets the shortest average time (21 seconds) because investors extract meaning from images faster than text. A screenshot that shows the core value in one glance outperforms a feature diagram every time.
Fix slides that block more than half of initial readers before anything else. A/B test one variable at a time — changing the problem slide headline and the solution visual simultaneously makes it impossible to know which change moved the number.
Pro Tip: *Replace dense bullet points with single-number callouts.
Using dwell-time signals to sequence follow-ups
Engagement data turns a generic follow-up sequence into a prioritized one.
- Follow up first with investors who spent more than 4 minutes or re-opened the deck within 48 hours. These are your warmest leads. Contact them within 24 hours of the re-read event.
- Nurture investors in the 2–4 minute range with no follow-up action. They read enough to be interested but did not convert. A short, specific message referencing a slide they likely spent time on can restart the conversation.
- Archive investors under 30 seconds with no re-open. Do not waste follow-up cycles here unless you get a warm intro later.
Message scaffolds by behavior:
- Re-read within 48 hours: “Hi [Name], I noticed you came back to the deck — happy to answer any questions or set up a 20-minute call this week.”
- 4+ minute first read, no response: “Hi [Name], wanted to follow up on the deck I sent [date]. The traction section has a few updates worth a quick conversation — are you open to a short call?”
- 2–4 minute read, no re-open: “Hi [Name], curious whether the [problem/market] framing resonated with your thesis. Happy to share more context on [specific slide topic].”
Keep subject lines specific. “Following up on [Company] deck” is forgettable. “Quick question on the market slide” is not.
Two-week sprint checklist to improve your metrics
Run this as a structured experiment, not a gut-feel revision cycle.
- Instrument per-investor, per-slide tracking before sending anything.
- Send the current deck to a small baseline sample (10–15 investors). Record per-slide dwell times and meeting conversion.
- Identify the one slide with the shortest dwell time in the first three slides.
- Change one variable on that slide only (headline, visual, or data point).
- Send the revised deck to a comparable sample. Compare per-slide dwell and meeting conversion.
Back up the original deck before any changes. Test the revised version on two or three friendly reviewers before broad outreach. Track outreach outcomes in the same spreadsheet as your dwell-time data.
How a raise-room solves the two silences
The two silences that kill fundraising momentum: an investor who never opened the deck and an investor who read every slide and passed look identical without tracking. Both produce zero response. The difference between them is everything.
BabyLoveRaise raise-rooms resolve this with per-investor, per-slide timestamps, first-read notifications, and share-link management across warm and cold outreach. Key capabilities:
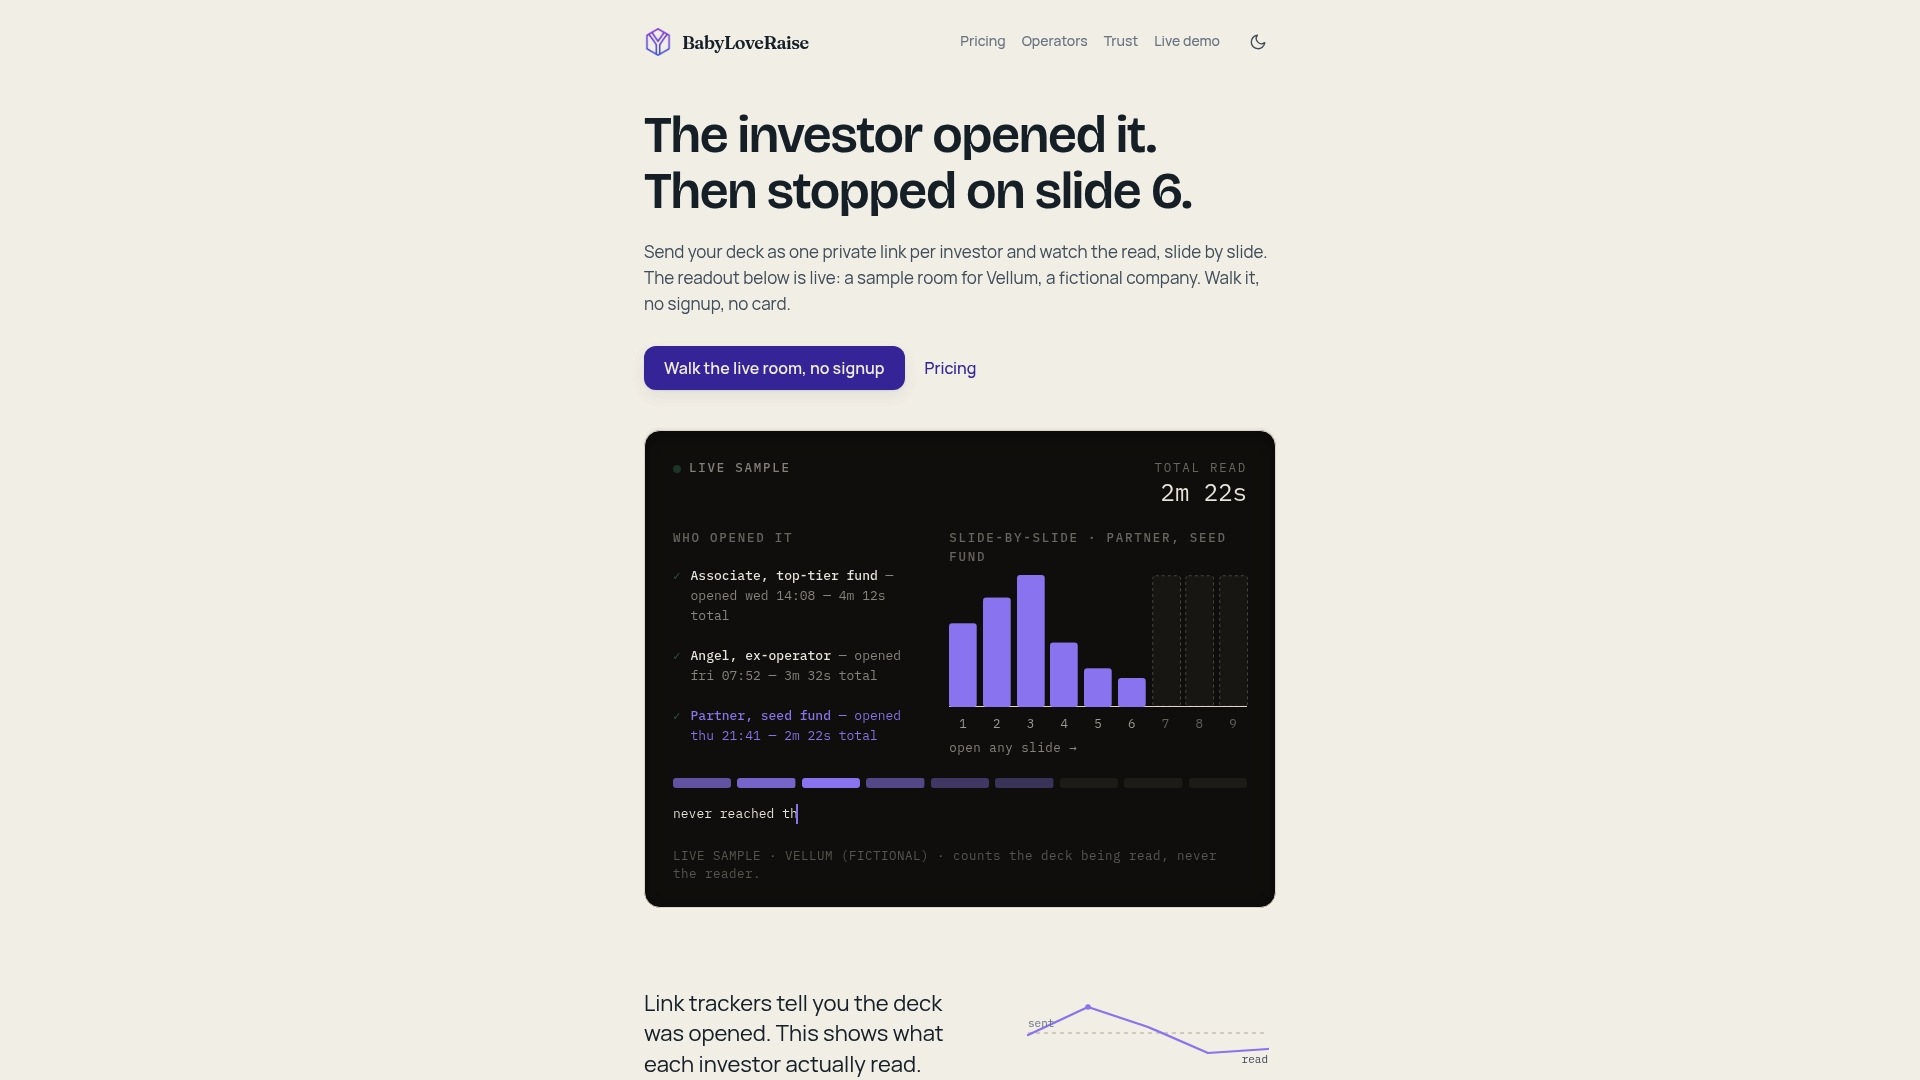
- Per-investor timelines showing exactly which slides were read and for how long
- Three share-link registers: first send, forwardable, and private
- First-read notification so follow-up timing is based on real behavior
- Operator console for fractional CFOs and fundraising advisors running multiple client raises
- Optional editorial pass for founders who want hands-on deck help
- Permanent archive when the raise closes, with no paywall cliff
A founder sends a raise-room link to 12 investors on a Monday. By Tuesday morning, one investor has re-opened the deck twice and spent 6 minutes total, with 90 seconds on the financials. The founder sends a targeted follow-up that afternoon referencing the financial model. A meeting is booked by Wednesday. Without per-slide dwell data, that investor looked identical to the eleven who never opened the link.
What the silence in your inbox is actually telling you
The conventional wisdom is that no reply means no interest. That is wrong half the time. What no reply actually means is that you do not have enough data to know. A founder who instruments their raise before outreach begins is not just collecting metrics — they are converting an ambiguous silence into a specific, answerable question: did this investor read the deck or not?
The per-slide signal matters for a different reason. Most founders revise their deck based on feedback from friendly advisors or pattern-matching from other decks. That is useful, but it is not the same as knowing that 14 out of 20 investors spent under 15 seconds on your problem slide. One is opinion. The other is evidence.
The 3-minute 44-second average is not a target to hit. It is a constraint to design around. Every slide that wastes 10 seconds of that budget on a dense bullet list or an unlabeled chart is a slide that reduces the probability of a meeting.
BabyLoveRaise: a raise-room built for this
Most document trackers were built for sales teams sharing proposals. BabyLoveRaise was built for one thing: a startup raise. Per-investor, per-slide dwell time is the core output, not a premium add-on. The raise room notifies you on first read, shows you exactly which slides held attention and which got skimmed, and gives you three share-link types so warm intros and cold outreach stay cleanly separated.
For fundraising advisors and fractional CFOs running multiple client raises, the Operator console runs firm-branded rooms across all clients at a fraction of virtual-data-room pricing. For founders who want hands-on help, an editorial pass is available alongside the room.
When the raise closes, the room converts to a permanent archive. No paywall cliff, no scramble to export before a subscription lapses. Start your raise room at BabyLoveRaise and know exactly who read your deck before your next follow-up goes out.
Sources
- What Investors Actually Read in Your Pitch Deck (DocSend Data) - PitchGrade
- We Analyzed 150 Seed Decks That Got Funded. The #1 Slide VCs Actually Care About Surprised Us. - From conversations to real-world change
- How to Measure Investor Engagement and Close Your Round