
How to Track Google Slides Views: A Founder's Guide
Discover how to track Google Slides views effectively. Learn strategies using Activity dashboards, Google Analytics, and BabyLoveRaise for insights.
August 7, 2026 · 8 min read

You can track Google Slides views three ways. Google Workspace’s Activity dashboard shows named viewers inside your domain. Publishing to the web plus Google Analytics captures aggregate public counts. And BabyLoveRaise delivers per-slide dwell, first-read alerts, and fundraising-specific analytics when native tools fall short.
Here’s the quick breakdown:
- Activity dashboard: See who viewed your file by name, but only if they share your Google Workspace domain and haven’t hidden their view history.
- Publish to web + Google Analytics: Get pageview counts and time-on-page for publicly shared Slides, with no viewer names attached.
- BabyLoveRaise: Per-slide engagement, first-read notifications, and raise-level pricing built for founders sending investor decks.
If you’re inside a company Workspace and want to see who on your team opened a Slides file, start with the Activity dashboard. If you’re a founder sharing a pitch deck externally, skip to the BabyLoveRaise section.
Table of Contents
- How to track Google Slides views with the Activity dashboard
- How to set up Publish to web with Google Analytics
- Privacy and Workspace limits you need to know
- Which tracking method should you use?
- Key Takeaways
- The method you pick shapes the follow-up you’re able to run
- BabyLoveRaise gives founders the tracking layer native tools skip
- Primary sources and further reading
How to track Google Slides views with the Activity dashboard
The Activity dashboard shows individual viewer names, a viewer trend chart, and each viewer’s last-seen timestamp. The catch: it only works when the file owner and the viewer are both signed into accounts within the same Google Workspace domain. Google’s own documentation is explicit on this point. If your file isn’t owned by a work or school Google account, view history is unavailable entirely.
How to open it
- Open your Google Slides file.
- Click Tools in the top menu bar.
- Select Activity dashboard.
- Navigate between the Viewers, Viewer trend, and Last viewed tabs.
The Viewers tab lists everyone who opened the file. Viewer trend shows opens over time as a chart. Last viewed tells you when each person most recently looked at it.
Account and Workspace caveats
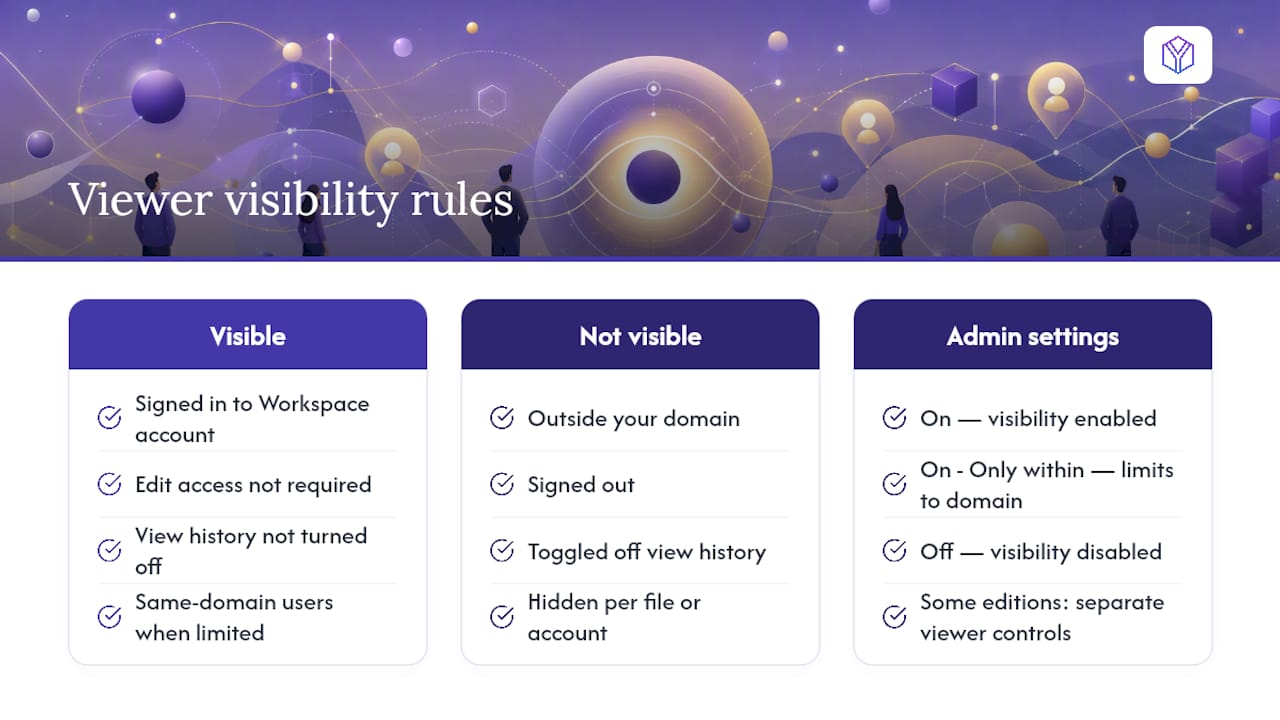
Edit access is not required to appear in the viewer list, but the viewer must be signed in to their Workspace account. Anyone outside your domain, anyone signed out, or anyone who has toggled off their view history will not appear. Users can hide their activity per file or across all files from their Google Account settings.
Workspace admins have three settings: On, On - Only within, and Off. “On - Only within” limits visibility to users inside the same domain. Some Workspace editions also expose separate controls for the Viewer trend and Viewers tabs specifically.
Pro Tip: If the Activity dashboard option is grayed out under Tools, your file is either owned by a personal Gmail account or your admin has disabled the feature at the domain level. Check with your Google Workspace admin before assuming the feature doesn’t exist.
How to set up Publish to web with Google Analytics
Publishing to the web creates a public URL for your Slides that anyone can open without a Google account. You can then point Google Analytics at that URL to capture pageviews and session data. It’s a workable low-cost approach for aggregate engagement, but it won’t surface signed-in viewer names.
- In your Slides file, go to File > Share > Publish to the web.
- Choose Link (for a shareable URL) or Embed (for an iframe you can drop into a webpage).
- Click Publish and copy the generated URL.
- In Google Analytics 4, add the published Slides URL as a data stream under your property, or wrap the link inside a tracked landing page you control.
- Share the published link with your audience.
- In GA4, check Reports > Engagement > Pages and screens to see pageviews and average engagement time.
What you actually get from this setup
Google Analytics records how many times the page loaded and how long sessions lasted. Converting static decks to web formats enables per-slide view-time analytics that a plain PDF link cannot provide. But GA4 gives you aggregate behavior only. You’ll see pageviews and average session duration — not individual viewer identities or per-slide timing.
For per-slide granularity, you’d need to export each slide as a separate page and set up individual GA4 events per URL, which adds real setup complexity. Data also arrives with a processing delay, typically 24–48 hours for standard reports.
One more thing worth knowing: some investors actively avoid gated or tracked links. Requiring an email before viewing can reduce open rates among cold contacts, even when the security benefit is real.
Pro Tip: To approximate per-slide engagement without a full GA4 event setup, export your Slides as individual images, build a simple one-page website with anchor links per slide, and track scroll depth or anchor-click events. It’s more work upfront but gives you slide-level signal without a specialist platform.
Privacy and Workspace limits you need to know
Before you track anything, these limits apply:
- Activity dashboard view history is visible only within the same Workspace domain. External viewers never appear.
- Users can hide their view history per file or globally. Even with admin settings enabled, individual users retain some control.
- Viewers who are not signed into a Google account are invisible to the Activity dashboard entirely.
- Admins can set domain-level enforcement, but on most Workspace editions users can still opt out of showing their own views.
- Personal Gmail accounts (not Workspace) have no Activity dashboard access at all.
On the legal side: if you’re sharing a deck with individuals in a professional context, a brief disclosure that the link is tracked is good practice. For sensitive audiences, such as employees, healthcare contacts, or anyone in a regulated industry, check whether your tracking method requires explicit consent under applicable state privacy laws.
Pro Tip: Use this phrasing when sending tracked links to new contacts: “The link tracks basic open and engagement data so I can follow up at the right time.” Short, honest, and it rarely generates pushback.
Which tracking method should you use?
| Method | Named viewers | Per-slide detail | Setup complexity | Cost | Best for |
|---|---|---|---|---|---|
| Activity dashboard | Yes, within domain | No | None | Free (Workspace) | Internal team files |
| Publish to web + GA4 | No (aggregate only) | With extra setup | Medium | Free (GA4) | Public or broadly shared decks |
| BabyLoveRaise | Yes, named | Yes | Low | Per raise | Investor outreach, fundraising |
Pick the Activity dashboard when your file stays inside your Workspace and you need to see which colleagues opened it. Pick Publish to web plus GA4 when you’re sharing publicly and aggregate counts are enough. Pick BabyLoveRaise when you’re running a fundraise, need to know which investors actually read the deck, and want per-slide signals to guide both follow-up and revisions.
Key Takeaways
The most effective way to track Google Slides views depends on your audience: native tools cover internal Workspace visibility, while fundraising workflows require per-slide, first-read tracking that only a specialist tool provides.
| Point | Details |
|---|---|
| Activity dashboard limits | View history only works within the same Google Workspace domain; external viewers are invisible. |
| GA4 gives aggregate data | Publish to web plus Google Analytics shows pageviews and session time, not named viewers. |
| Per-slide detail requires a specialist | Native Google tools don’t show which slides held attention or when an investor first opened the deck. |
| Privacy controls matter | Users can hide their own view history; admins control domain-level visibility with three settings. |
| BabyLoveRaise fills the gap | Per-slide dwell, first-read alerts, and raise-level pricing make it the right tool for investor outreach. |
The method you pick shapes the follow-up you’re able to run
Most founders treat tracking as a binary: either they sent the deck or they didn’t. The real question is what happens in the silence after the send. Two investors who haven’t replied look identical in your inbox. One never opened the link. The other read every slide twice and stopped on your financials for four minutes. Those are not the same situation, and they don’t deserve the same follow-up email.
Native tools like the Activity dashboard were designed for internal collaboration transparency, not investor outreach. That’s not a criticism; it’s just the wrong tool for the job. GA4 gets you closer for public sharing, but aggregate pageviews don’t tell you whether the person who mattered actually read past slide three.
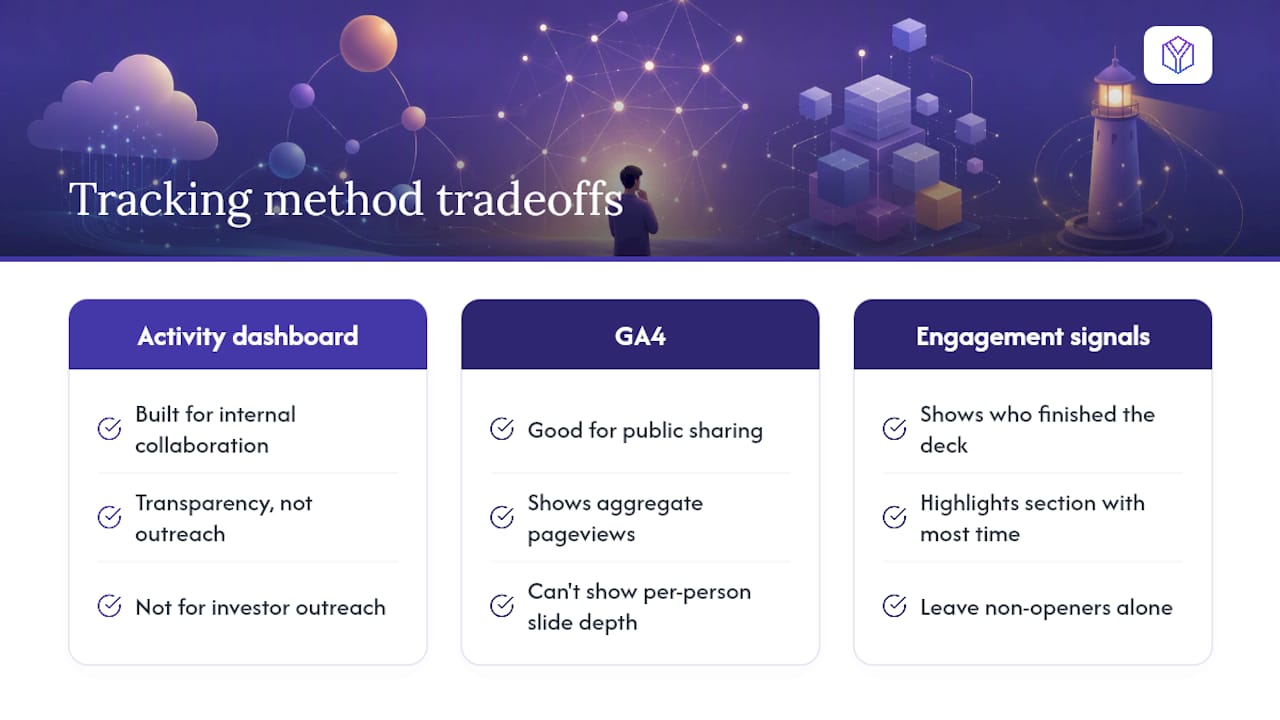
The founders who use engagement signals well don’t follow up more. They follow up better. They reach out to the investors who finished the deck, reference the section that got the most time, and leave the non-openers alone until there’s a reason to re-engage. That’s not surveillance. It’s just paying attention to the signals your deck is already generating.
BabyLoveRaise gives founders the tracking layer native tools skip
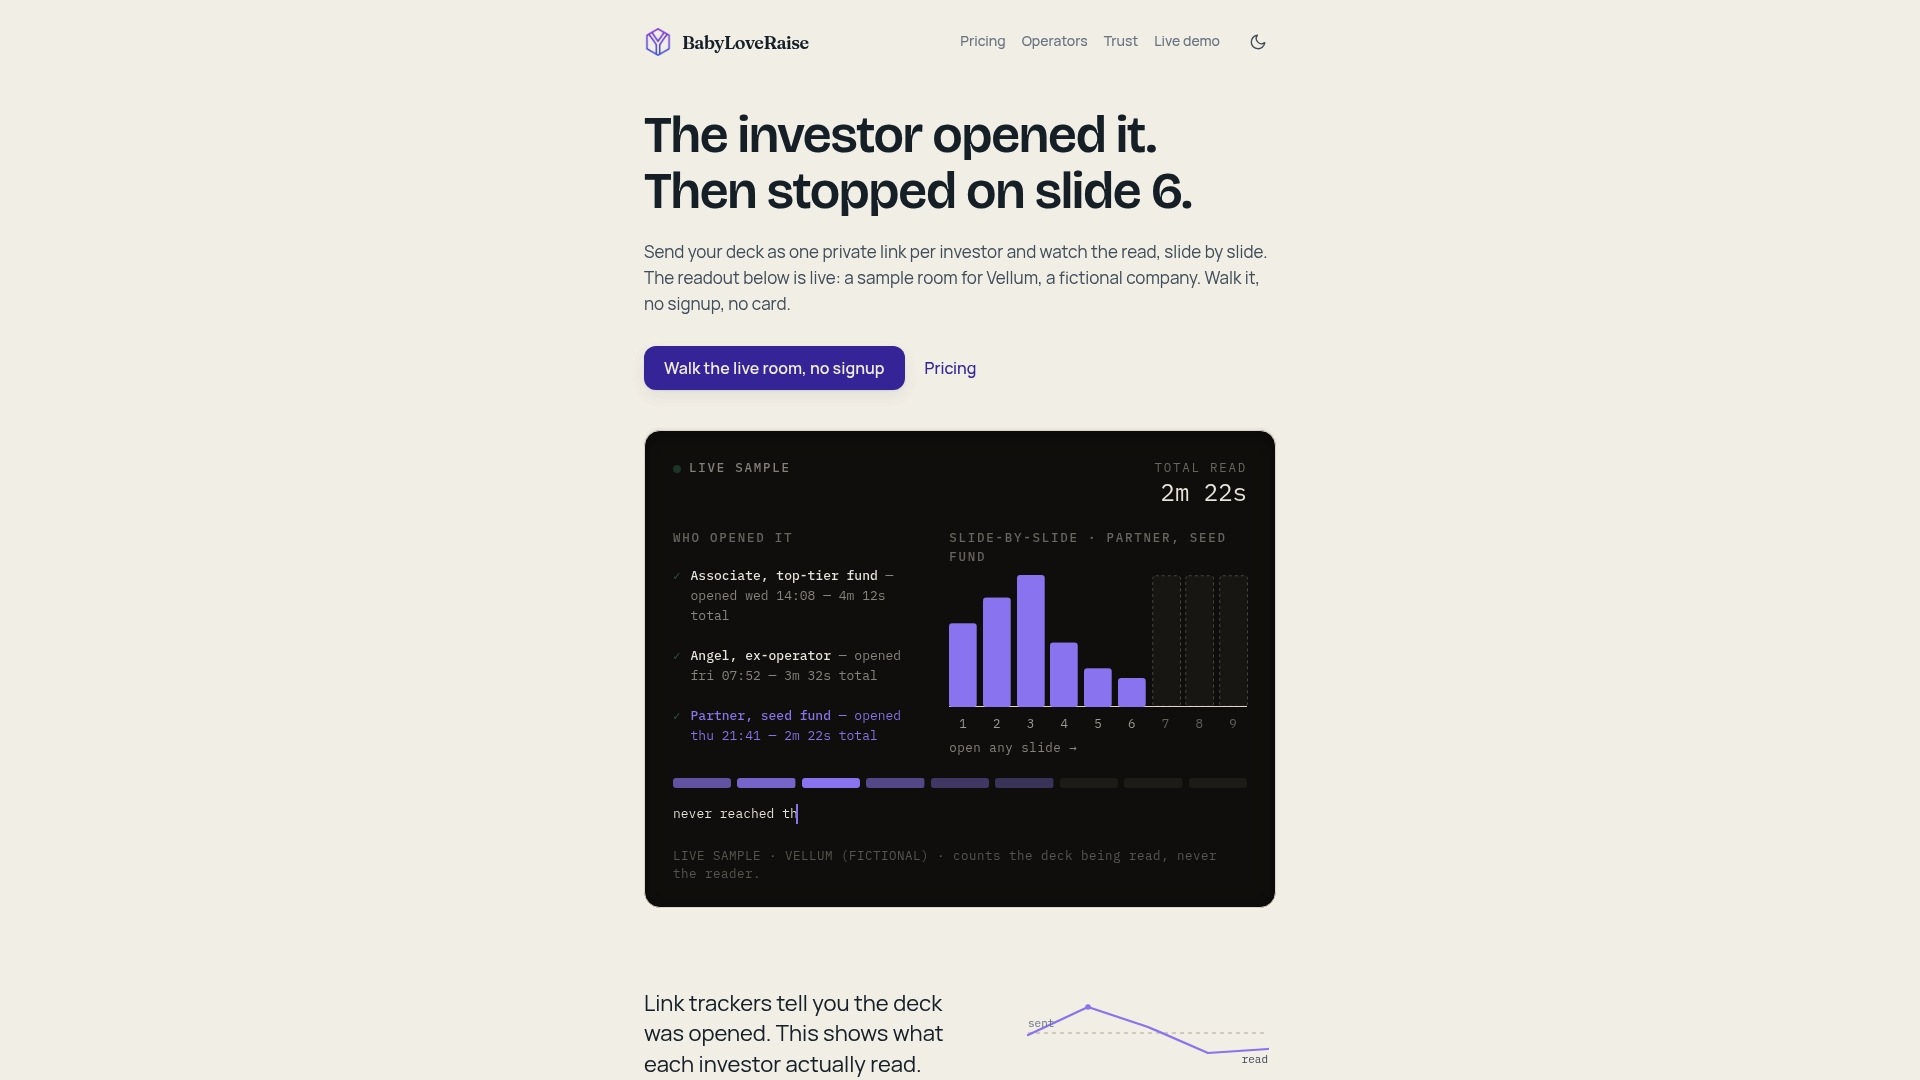
If you’re running a pre-seed or seed raise, the gap between “I sent the deck” and “I know who read it” is where deals stall. BabyLoveRaise closes that gap with a hosted raise room that sends a first-read alert the moment an investor opens your deck, records per-slide dwell time so you know exactly where attention dropped, and tracks named viewers without requiring investors to log in or jump through gates.
Pricing is per raise, not a monthly seat fee that runs indefinitely. When the raise closes, the room converts to a permanent archive. For advisory firms managing multiple client raises, the Operator tier runs firm-branded rooms across all clients at a fraction of virtual-data-room pricing.
Start your raise room at BabyLoveRaise and send your next deck with the signal layer it needs.
Primary sources and further reading
The following sources were used to build this guide. Google documentation links are primary sources; the others are third-party commentary.
Google documentation (primary):
- View the activity on your Google Docs, Sheets & Slides — Computer - Google Docs Editors Help
- Mobile Pitch Deck — Converting Static PDF Pitch Decks into Responsive Mobile Presentations — FRANKI T
- Interactive sales proposals vs PDFs: why modern buyers expect web-based experiences
- Traditional PDF vs Interactive Web-Based Pitch Decks
- BabyLoveRaise
Third-party context:
- BabyLoveRaise — product documentation for raise rooms, per-slide tracking, and first-read detection.