
Fundraising Funnel Metrics Every Founder Should Track
The fundraising funnel metrics that matter for a pre-seed or seed raise: stage conversion, deck engagement, velocity and the business numbers investors ask for.
October 31, 2026 · 13 min read

Track your raise like a pipeline with five kinds of numbers: how many investors you contact, how many open and finish your deck, how many take a meeting, how fast they move between stages, and how many reach diligence and a term sheet. Each number tells you which part of the raise to fix: your targeting, your deck, your pitch or your follow-up. Most founders only count “meetings booked.” That hides where the funnel actually leaks.
BabyLoveRaisebabyloveraise.comSee Where Investors Drop OffBabyLoveRaise tracks deck opens and per-slide engagement, helping founders distinguish unread pitches from investor interest that needs a follow-up.Explore deck trackingTL;DR
- A startup fundraising funnel runs from contact to reply, deck read, first meeting, second meeting, diligence, term sheet and close. Measure the conversion between each pair of stages.
- Move an investor to the next stage only on something they did: opened the deck, held a meeting, asked for the data room. Never on a feeling.
- Deck engagement (who opened, who finished, which slides lost people) is the earliest signal you get, weeks before a meeting happens.
- Benchmarks vary a lot by founder, traction and market. Use them to sanity-check your volume, not to grade yourself.
- Investors will also ask for business metrics such as ARR, retention, CAC and burn multiple. Have them ready and calculated the standard way.
Table of Contents
- What a fundraising funnel actually is
- The core funnel metrics, and how to calculate them
- Deck engagement: the earliest funnel signal
- Benchmarks: useful for planning, dangerous for judging
- Diagnosing bottlenecks
- The business metrics investors will ask for
- Our perspective
- Put the funnel on one page
- A simple weekly review routine
- FAQ
- Sources
What a fundraising funnel actually is
The search results for this topic are dominated by nonprofit donor metrics: donor retention, average gift, lifetime value. A startup raise is a different animal. You have a small, finite list of investors, a handful of meetings, and a few checks at the end. The funnel is a list of stages that each investor moves through, and the metrics are the counts and ratios between those stages.
One published pipeline template lists stages from sourced and researched through contact, first or second meeting, partner meeting, diligence, term sheet, committed and funds received. You do not need that many. For most pre-seed and seed founders, seven stages are enough:
- Targeted: the investor is on your list because they fit your stage, check size and sector.
- Contacted: you sent the deck, ideally through a warm intro.
- Deck read: they opened it, and you know how far they got.
- First meeting: a call or a pitch happened.
- Second meeting or partner meeting: more decision-makers are involved.
- Diligence: they asked for the data room, references or financials.
- Term sheet and close: a written offer, then money in the bank.
If you want a deeper walk through how to build and size this list, see our guide to investor pipeline stages for founders.
The rule for moving an investor forward
A funnel is only useful if the stages are verifiable. One pipeline guide makes the point that investors should advance on actions such as a meeting held or data room access granted, not on perceived interest. “They seemed excited” is not a stage. “They booked a second call with a partner” is.
This matters because enthusiasm is the most common source of bad data in a raise. Polite investors are very good at sounding interested. Behavior is harder to fake.
The core funnel metrics, and how to calculate them
Here are the ratios worth tracking, in the order they appear in the raise.
| Metric | How to calculate it | What it tells you |
|---|---|---|
| Reply rate | Replies ÷ investors contacted | Whether your targeting and intro quality are right |
| Deck open rate | Investors who opened the deck ÷ investors sent it | Whether your subject line and sender context work |
| Deck completion rate | Investors who reached the last slide ÷ investors who opened it | Whether the deck holds attention |
| Deck-to-meeting rate | Meetings booked ÷ investors who opened the deck | Whether the story earns a conversation |
| First-to-second meeting rate | Second meetings ÷ first meetings | Whether the pitch and the business hold up live |
| Meeting-to-diligence rate | Diligence starts ÷ second meetings | Whether your traction and answers survive scrutiny |
| Diligence-to-term-sheet rate | Term sheets ÷ diligence starts | Whether the details, terms and references land |
| Stage velocity | Days between stage changes, per investor | Where momentum slows |
Every one of these has a denominator that is a count of people, so keep the list small and clean. If you contact 300 investors with no filter, your reply rate will look terrible, and the number will be telling you the truth: your list was wrong.
Volume, velocity and conversion
Funnel analysis in marketing comes down to three things: how many go through each stage (volume), how fast (velocity), and what share make it (conversion). The same applies to a raise. Velocity is the one founders neglect. A raise is a race against your runway and against investor attention. If the median time from first meeting to second meeting is two weeks, and one investor has been silent for five, that is a data point, not a mood.
Track three timing numbers:
- Days from sending the deck to the first open.
- Days from first meeting to your next touchpoint.
- Days from second meeting to a decision.
When you can run several investors through the same stages in the same window, you create a natural comparison. It is much easier to ask a firm for a decision when you can honestly say other conversations are moving to the next step.
Deck engagement: the earliest funnel signal
Meetings are a late signal. By the time you count them, weeks have gone by. Deck engagement shows up within hours of sending, and it splits two situations that look the same from your inbox: the investor who never opened the file and the investor who read all of it and passed.
The useful measurements:
- First open: the moment someone actually looks. This is your cue to follow up while the deck is fresh.
- Completion: did they reach the last slide, or stop at the market slide?
- Per-slide time: which slides held attention and which were skimmed.
- Re-views and forwards: a deck reopened a few days later, or passed to a partner, is often a stronger signal than a polite reply.
One founder-facing guide suggests that very short total view time points to a polite pass, while several minutes suggests real interest. Treat those thresholds as rough guides: a crisp seven-slide deck can be read well in less time than a dense twenty-slide one. The pattern across your own investors is more reliable than any outside number.
What to do with engagement data
- Many opens, few completions: the first slides are fine but something in the middle loses people. Look at where dwell time collapses and rewrite that slide.
- High completion, few meetings: the deck works but the ask, the traction or the fit does not. Revisit your target list before you rewrite the deck.
- Low opens: this is a delivery problem. Check the intro, the subject line and who it came from.
- One investor reading closely and re-viewing: follow up the same day with something specific, such as an answer to a question the slides raise.
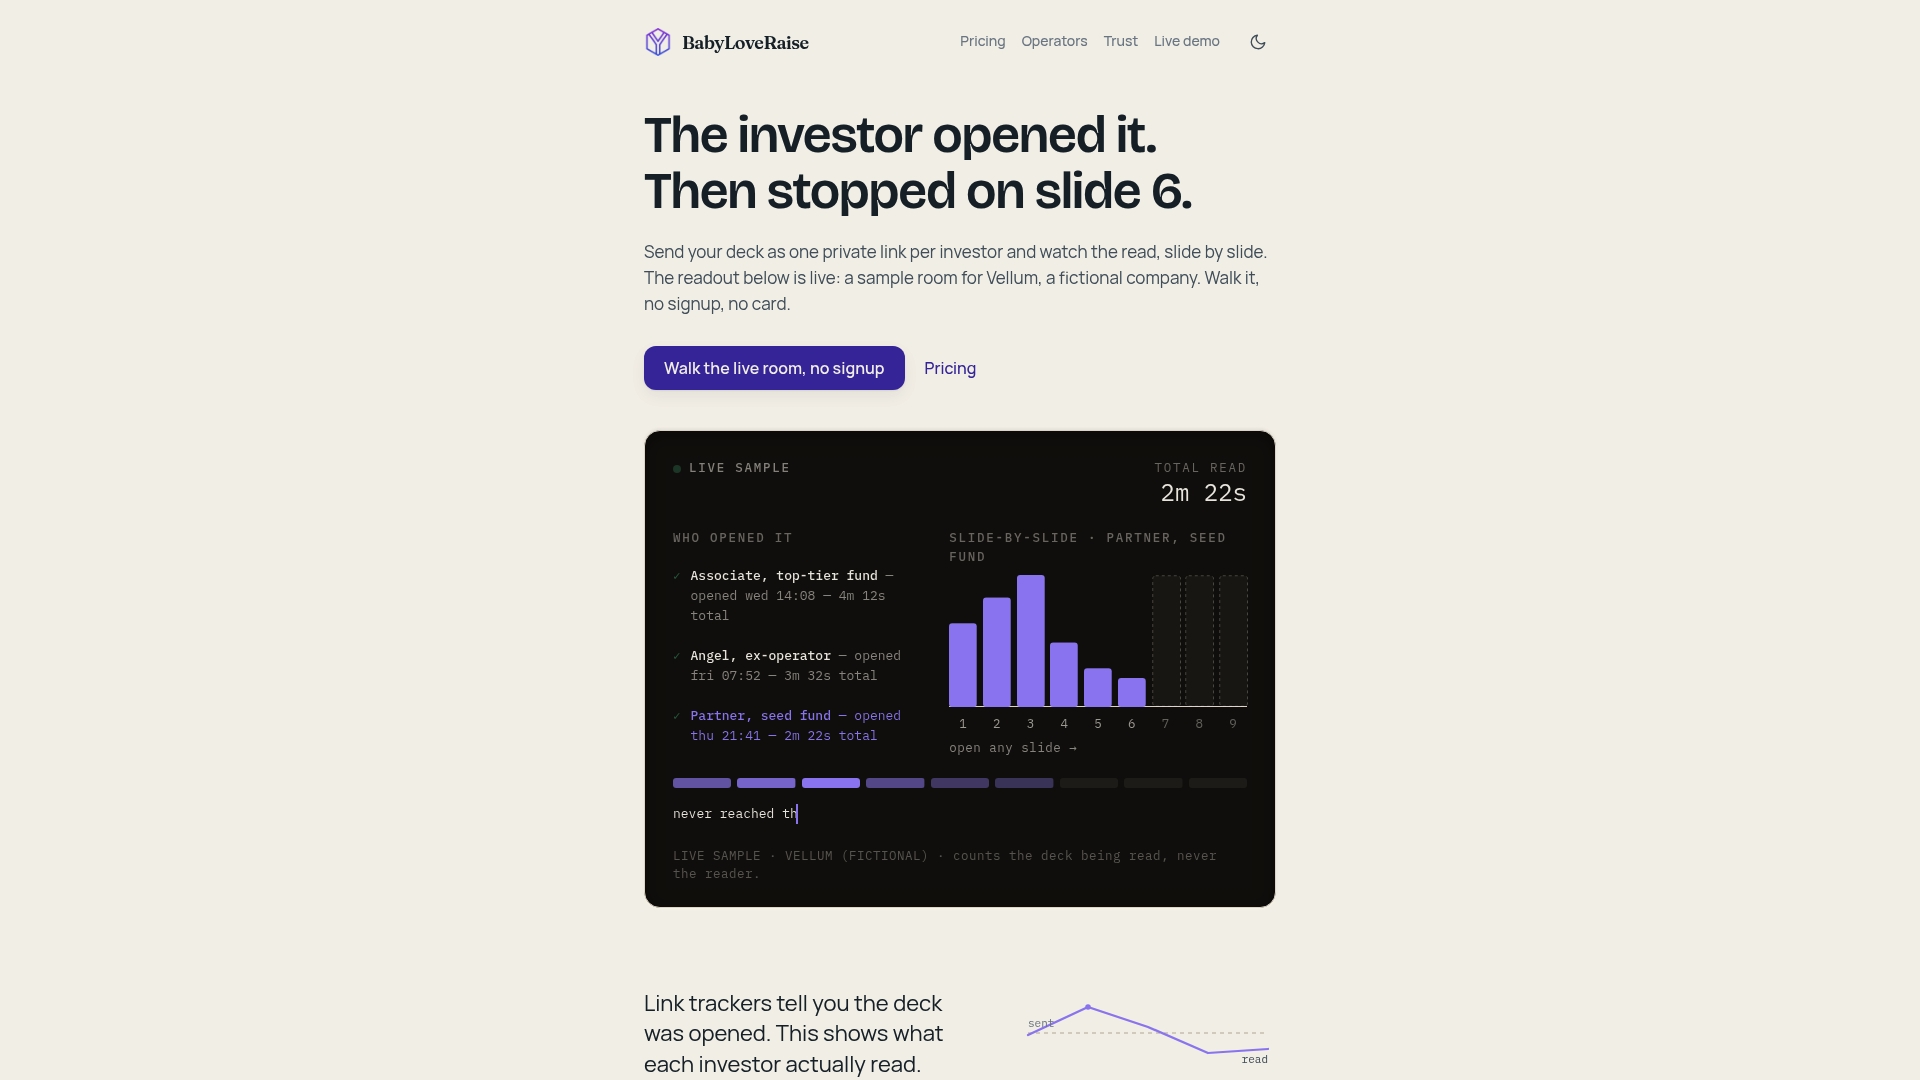
This is the gap a hosted room is built to close. Instead of sending a PDF and waiting, you send one link and see who opened it, who finished it and which slides were skimmed. We cover the tooling side in our guide to startup fundraising software for early-stage founders.
Benchmarks: useful for planning, dangerous for judging
Founders love a number to compare against. Here are a few that circulate, and how to use them.
A 2025 SEC staff report describes how a $3 to 4 million seed round can involve contacting 200 or more investors, 60 or more first meetings, 20 to 30 follow-up meetings, 5 to 7 diligence processes and 1 to 2 viable term sheets. The same report notes that seed has become an elastic category that now spans pre-seed, seed and pre-Series A activity, which is a good reason to be careful comparing yourself with anyone else’s “seed.”

A 2026 benchmark from a fundraising knowledge base suggests that pre-seed raises of $250K to $1M often involve 30 to 50 meetings at an 8 to 15% conversion rate, and seed raises of $1M to $4M involve 40 to 60 meetings at 5 to 10%. The same source also sketches a “funnel math” example that you can adapt.
A worked example
Take a simple model starting from 100 contacts:
| Stage | Count | Conversion from previous stage |
|---|---|---|
| Contacted | 100 | n/a |
| First meetings | 40 | 40% |
| Second meetings | 20 | 50% |
| Deep diligence | 10 | 50% |
| Term sheets | 3 | 30% |
This is a model from the same benchmark source, and it is optimistic next to the SEC’s description, where a large outreach list yields only one or two viable term sheets. The gap between the two is the point: your real numbers depend on your traction, your network and the market you raise in.
How to use it: work backward. If you need two term sheets, and your early data shows roughly one in four first meetings becoming a second meeting, you can estimate how many first meetings you must book. Then check whether your target list is big enough to produce them. That is the logic behind building a list of 40 to 50 well-chosen targets rather than blasting hundreds.
How to read your own numbers
- Compare across stages, not to a stranger’s average. The question is which stage in your funnel is weakest relative to the others.
- Wait for a sample. Ten investors is not a trend. Review conversion after you have sent to a meaningful batch, and change one thing at a time.
- Segment. Angels, seed funds and strategic investors behave differently. A blended rate can hide that one group loves you and another never replies.
- Watch the trend. A first-meeting rate that falls as you work down the list usually means your best-fit investors are already used up.
Diagnosing bottlenecks
The point of all this counting is diagnosis. A fundraising guide on funnel strategy notes that low progression from first meetings to follow-up can point to pitch or positioning problems, and that you can then adjust messaging, targeting or response times. Here is a field guide, mapped to where the funnel leaks.
| Where it leaks | Likely cause | First fix to try |
|---|---|---|
| Contacted to reply | Wrong investors or cold intros | Tighten the list by stage, check size and sector; get warm intros |
| Reply to deck open | Weak subject line, or the deck is behind a hurdle | Shorten the ask; send a single link, not an attachment chain |
| Open to completion | Slow start or a confusing middle slide | Rework the slide where dwell time drops |
| Completion to meeting | Unclear ask or weak traction proof | Lead with traction; state round size and use of funds plainly |
| First to second meeting | Pitch does not answer the partner’s real question | Rehearse objections; collect the questions you were asked |
| Second meeting to diligence | Missing materials or shaky numbers | Prepare the data room before you need it |
| Diligence to term sheet | Terms, references or metrics fail to reassure | Prepare references; make metrics reconcile |
One caution on interpreting silence. When an investor never replies after reading the whole deck, the data says “read and passed,” so stop chasing and ask for a short note on why. When an investor never opened the deck, the answer is a different follow-up: a short, specific nudge or a new route in. Treating those two states the same is the most common waste of founder time in a raise.
The business metrics investors will ask for
Funnel metrics describe your raise. Investors will also test your company. For SaaS startups, one guide to seed-stage metrics lists CAC, LTV, the LTV to CAC ratio, ARR, retention and burn rate, and gives the standard calculations:
- ARR: paying customers multiplied by average revenue per customer, annualized.
- CAC: total sales and marketing spend divided by the number of new customers.
- Burn rate: starting cash plus new revenue minus ending cash, divided by the number of months.
Another source describes the burn multiple, meaning the dollars you spend to add a dollar of new ARR, and says that a multiple above three is generally considered high. If you are pre-revenue, investors will substitute other proof: pilots, waitlist conversion, letters of intent or usage depth. Whatever you present, define each metric in a footnote and make sure it reconciles with your financial model. Inconsistent definitions cause more diligence stalls than bad numbers do.
Our perspective
We built BabyLoveRaise around one observation: a solo founder has no cofounder to read the room for them, and the deck is the one asset every investor sees before they say anything. Per-slide attention is the closest thing a founder gets to a second opinion. If three of your first five readers stop on the same slide, that is not bad luck. It is your deck telling you something.
We also think the two silences that look identical in an inbox, “never opened it” and “read everything and passed,” deserve different actions, and most tools do not separate them. General document-sharing products treat a raise like any other file share. A raise has its own rhythm: a finite target list, a handful of weeks, a first-read moment that matters. That is why our rooms report on the document and its engagement, never on surveilling the person, and why pricing follows the raise rather than a seat that bills forever.
Our advice, whichever tools you use: keep the list short, define every stage by an action, review conversion weekly, and change one variable at a time.
— Paul
Put the funnel on one page
If you want the deck-engagement layer without stitching it together yourself, the raise room gives you one link per send, a first-read notification and per-slide engagement for each investor. It is $149 per month or $399 per quarter on our pricing page, where you will also find the editorial pass for founders who want a human review of the deck before it goes out. Advisory firms and fractional CFOs running several raises can look at the operator plans.
A simple weekly review routine
You do not need a data team. Keep a spreadsheet or CRM with one row per investor, and spend thirty minutes every week on the same five questions:
- How many investors moved forward a stage this week, and on what action?
- Which investors opened the deck but did not reply, and what did they spend time on?
- Which stage has the lowest conversion relative to the others?
- Who is overdue for a follow-up based on your own velocity numbers?
- What one change will you test next week, in the deck, the pitch or the target list?
Write down the answer to the last question and look at it next week. Raises tend to go wrong when founders make five changes at once and cannot tell which one mattered.
Keep the timeline in view too. One 2026 breakdown of seed timelines describes four gates across roughly 16 weeks: materials, first meetings, lead investor and close. Treat that as a rough shape rather than a promise. If you are three weeks into outreach with no first meetings, the funnel data should tell you whether to fix the list, the deck or the intros, and you should decide while you still have runway to act.
FAQ
What are the most important fundraising funnel metrics for a seed round?
Start with reply rate, deck completion rate, deck-to-meeting rate, first-to-second-meeting rate and diligence-to-term-sheet rate. Add stage velocity, meaning days between stages. Together they show whether your problem is targeting, the deck, the pitch or follow-up.
How many investors should I contact?
It depends on your round and network. An SEC staff report describes seed rounds where 200 or more investors are contacted to reach one or two viable term sheets. A tighter list of well-fit targets with warm intros often does more than volume, so size your list from your own conversion rates.
What is a good conversion rate from meeting to investment?
Published figures are wide ranges, such as 5 to 10% for seed rounds in one 2026 benchmark, and they depend on traction and market conditions. Use them to plan how many meetings you need, then replace them with your own rates as soon as you have a sample.
How do I know if investors are really reading my deck?
Send the deck as a trackable link rather than an attachment, then look at first open, completion and time per slide. An investor who finishes the deck and reopens it later is showing more interest than one who replies politely but never opens it.
Should I track fundraising metrics in a CRM or a spreadsheet?
Either works if every investor has one row, one current stage and a dated action behind that stage. Choose the one you will actually update weekly. Add deck engagement data to the same row so follow-ups are driven by what each investor did.
Sources
- How to Track and Manage Your Startup Fundraising Pipeline
- 2025 OASB Staff Report
- How Many Meetings to Raise Funding?
- Fundraising Funnel Strategy for Startup Growth
- The SaaS Founder’s Guide to Seed Stage Fundraising Metrics
- Stage-based startup metrics that impact valuation
- Seed Round Timeline: How Long a 2026 Raise Takes