
Investor Update Analytics: What to Track and How to Read It
Investor update analytics explained for founders: which company metrics to include, what open and read data can and can't tell you, and how to act on it.
November 11, 2026 · 13 min read

Investor update analytics covers two separate things. The first is the business metrics you report: revenue, burn, runway, headcount. The second is engagement data about the update itself: who received it, who opened it, who read to the end, and which sections held attention. Founders who handle both can send shorter updates, follow up with the right people, and learn what their investors care about.
This guide covers both halves, the limits of each, and a simple routine for turning the numbers into action.
BabyLoveRaisebabyloveraise.comKnow Who Read Your Fundraising DeckBabyLoveRaise tracks first reads and slide engagement in a hosted raise room, helping founders distinguish unread decks from investors who read through.VisitTL;DR
- Report a small, stable set of company metrics every month: revenue, expenses, net burn, ending cash, headcount and fundraising status, plus a few KPIs specific to your business.
- Engagement data tells you who noticed and who acted. It does not tell you whether your update persuaded anyone.
- Email opens are a weak signal on their own. Clicks, time on a page and replies say more.
- Review metrics on a fixed cadence (weekly pulse, monthly health, quarterly strategy) so you don’t drown in dashboards.
- Use what you learn to decide who gets a follow-up, which sections to cut, and what to put first next time.
Table of Contents
- What investor update analytics actually measures
- Layer one: the company metrics worth reporting
- Layer two: measuring whether investors read your update
- A tracking approach that respects your investors
- How often to review the data
- Benchmarks: use them as directions, not scores
- Turning the data into better updates
- A simple monthly routine
- Perspective: why founders should treat updates as part of the raise
- Run your raise from one room
- FAQ
- Sources
What investor update analytics actually measures
It helps to keep two layers apart, because founders often blur them.
Layer one: company performance. These are the numbers inside the update. They answer “how is the business doing?” Investors use them to decide how worried or excited to be and whether to offer help.
Layer two: update engagement. These are the numbers about the update. They answer “is anyone reading this, and what are they reading?” You use them to decide how to communicate.
The first layer is the content. The second is the delivery. A strong update with no readers does nothing. A well-read update with weak numbers still tells you something useful: your investors are paying attention and will notice the trend.

The distinction matters most when you are raising. A current investor who stops opening your updates is a different signal from a prospect who reads your deck twice. Both sit in the second layer, and both change what you do next.
Layer one: the company metrics worth reporting
There is no single mandatory dashboard, but early-stage investors tend to look for the same vital signs. Right Side Capital describes a set of universal metrics for pre-seed and seed companies: revenues, total expenses, net burn, fundraising status and details, ending cash, and full-time employees, each with its month-over-month change. The same post adds business-specific KPIs on top, so a marketplace and a developer-tools company will not report the same extras.
The universal set works because it lets an investor triage quickly. If cash, burn and headcount look as expected, they can skim the rest. If something moved sharply, they know where to look.
Pre-seed versus seed
What counts as the right KPI shifts with stage. Mercury’s stage-based guide says that at pre-seed investors underwrite market understanding and opportunity, so early engagement signals matter: waitlist growth, activation rates, usage frequency and retention, alongside burn and runway. At seed, the same guide says investors want proof the model repeats: MRR or ARR, CAC and LTV, churn and cohort behavior, burn multiple, and runway.
| Stage | Core metrics to lead with | Supporting detail |
|---|---|---|
| Pre-seed | Burn, runway, cash, headcount | Waitlist growth, activation, usage frequency, early retention |
| Seed | MRR or ARR, net burn, runway, cash | CAC and LTV, churn, cohorts, burn multiple |
If you need help picking financial KPIs that fit your stage, this guide to stage-appropriate startup financial indicators shows how outside parties read a young company’s numbers.
Get the numbers right before you send them
Bad data does more damage than missing data. Zinance suggests a monthly package covering P&L, balance sheet, cash flow, burn, runway and ARR, delivered within days of month-end, and notes that a clean close typically takes three to six business days. Its advice is to work backward from your send date and have a second person review the P&L before it goes out.
For a solo founder, that second reader may be a fractional CFO, a bookkeeper or an advisor. The point is that a wrong number in an update costs you more trust than a late one.
Layer two: measuring whether investors read your update
Now the part most founders skip. You send an update to twenty people and hear back from three. What happened with the other seventeen?
There are four levels of evidence, from weakest to strongest:
- Delivered. The message did not bounce.
- Opened. Something loaded the message.
- Engaged. The person clicked through, scrolled, or spent time on a page.
- Acted. They replied, made an intro, asked for a call, or wired money.
Most founders only see levels one and two, which is why the data feels thin.
Why you should hold opens loosely
Open data can show whether people noticed an email, and clicks show whether the message earned a next action. But as one email-marketing explainer puts it, these metrics do not show whether the body of the message was persuasive. An open tells you the subject line did its job. It says little about the substance.
Opens are also noisy in practice. Some mail apps preload images for privacy, which can register an open when no human looked. Treat a single open as “possibly seen” and a repeat visit, a click or a reply as real interest.
Put the detail behind a link
The most practical fix is to keep the email short and put the full update, or a deck with the supporting numbers, behind a single tracked link. That moves the measurement from the inbox, where it is unreliable, to a page you can observe. You can then see:
- Whether the person reached the page at all.
- How far down they read.
- Which sections they lingered on and which they skipped.
- Whether they came back, and whether they forwarded it.
This is the same logic behind per-slide tracking for pitch decks. If you want the deck side of this, see our guide to pitch deck analytics for founders, and for a ready-made format, our 15 minute investor update template with engagement tracking.
Two identical silences, two different meanings
When an investor doesn’t reply, you usually can’t tell why. Engagement data splits that silence in two:
| What you see | What it likely means | What to do |
|---|---|---|
| Never opened or visited | The message was missed, filtered or ignored | Resend with a new subject line or a short personal note |
| Read to the end, no reply | Read it, may be watching, may have passed | Send a specific, low-effort ask, such as a question about one metric |
| Read one section twice | One topic matters to them | Offer more detail on that topic |
| Forwarded to others | Your update is being shared inside their firm | Make sure the update stands on its own |
The labels are hypotheses, not facts. The data shows behavior with a document, not what someone thinks.
A tracking approach that respects your investors
Investors are people with working relationships with you, not leads in a funnel. Engagement tracking works best when it reports on the document and not on the person. Measure what happened to the update: pages viewed, sections read, time spent. Don’t try to follow an investor around the web or work out their location or device habits.
It is also worth being plain with your readers. A short line in your footer such as “this update uses a private link so I can see which sections are useful” costs nothing and heads off any discomfort.
Privacy rules in the US are a patchwork. California, for example, gives residents rights to know about, delete and correct personal data and to opt out of its sale or sharing, and companies describe how they collect online activity in their notices, as in this California privacy notice from an investment firm. If you send updates to investors in several states, keep your tracking limited to document-level engagement, and ask your lawyer if you plan to collect anything beyond that.

How often to review the data
More dashboards do not mean more insight. Fairview recommends a three-layer structure of weekly pulse, monthly health and quarterly strategy reviews, so you check each metric at a pace that matches how fast it changes. The same post warns that an unreliable dashboard is worse than none because it builds false confidence, so refresh your data sources before every review.
For update analytics, a workable version looks like this:
- Weekly, during a raise: check who has opened or read your latest materials and who needs a follow-up. Our investor follow-up strategy for seed founders covers timing.
- Monthly, after each update: look at read-through, section attention and replies. Note which items drew questions.
- Quarterly: compare the last three updates. Are the same people reading? Is attention rising or falling? Does the structure still fit what investors ask about?
If you want a model for keeping reviews tied to metric volatility without overreporting, this 90-day reporting metrics plan lays out a cadence you can borrow, even though it comes from marketing.
Benchmarks: use them as directions, not scores
Founders ask what a “good” read rate is. There is no reliable universal number for investor updates, and be wary of anyone who gives you one. Aim to beat your own previous updates and your own list.
There is one useful principle. AngelsPartners’ outreach report argues that benchmarks are directional guides, not absolute scores, and that warm introductions routinely open at about double the rate of cold emails. The takeaway is that who you send to matters more than how many you send to. A smaller list of investors who know you will read more than a large list of strangers. For more on that trade-off, see our piece on warm intros versus cold email.
Turning the data into better updates
Collecting data is the easy part. Here is how to use it.
1. Reorder by attention
If readers consistently drop off after the second section, your most important content is in the wrong place. Move the metrics and the ask to the top. Put the narrative and the longer detail lower.
2. Cut what nobody reads
Sections that get skimmed every month are candidates for a single line or a link. Updates that shrink to what investors use get read more.
3. Follow up on behavior, not on a calendar
A reader who finished your update and went back to the metrics page deserves a different message than someone who never opened it. The first gets a specific question or an offer to talk. The second gets a short, easy resend. Our guide to sending per-investor tracked links and following up within 48 hours shows how to set this up.
4. Make asks specific
An update that ends with “let me know if you can help” produces little. An update that says “we want intros to three Series A funds focused on logistics software” gives a reader something to do. Track which asks get a response and which are ignored.
5. Watch the send time, but not obsessively
Timing matters at the margins. If you want a starting point, see our notes on the best day and hour to send investor emails. Content and relationship will outweigh timing.
A simple monthly routine
Here is a routine that takes about an hour once it is set up.
- Days 1 to 5: close the books and verify revenue, expenses, burn and cash. Have a second person check them.
- Day 6: write the update. Lead with the headline, three wins, three challenges, the metrics, and one specific ask.
- Day 7: send it from your own email with a single tracked link to the full version.
- Days 8 to 10: check who read it and how far. Send individual replies to anyone who engaged, and a light resend to those who didn’t.
- End of month: note what you learned and one change for next time.
Stick to this for a quarter and you will have a record of what your investors respond to, which is more useful than any generic benchmark.
Perspective: why founders should treat updates as part of the raise
We see the same pattern in almost every founder we talk to. The deck goes out, the investor update goes out, and then there is silence that looks the same whether someone ignored it or read every word and quietly passed.
That silence is the problem. A solo founder has no cofounder to ask “did that land?” So the reader’s behavior has to answer for them: who opened it, who got to the end, which slide or section held attention and which got skimmed.
Our view is that this data should report on the document, never on the person. It should turn two identical silences into two different, actionable states, so your follow-up goes to people who actually read and your revisions target the places where attention died.
That is why we built BabyLoveRaise around the raise itself, and why we price it per raise rather than per seat forever.
Paul
Run your raise from one room
If you are preparing a seed or pre-seed raise, BabyLoveRaise gives you a hosted raise room for your deck. You send one link, get notified on first read, and see per-slide engagement so you know who finished the deck and which slides lost people. Share links come in three registers (first send, forwardable and private), and when the raise closes the room converts to a free permanent archive.
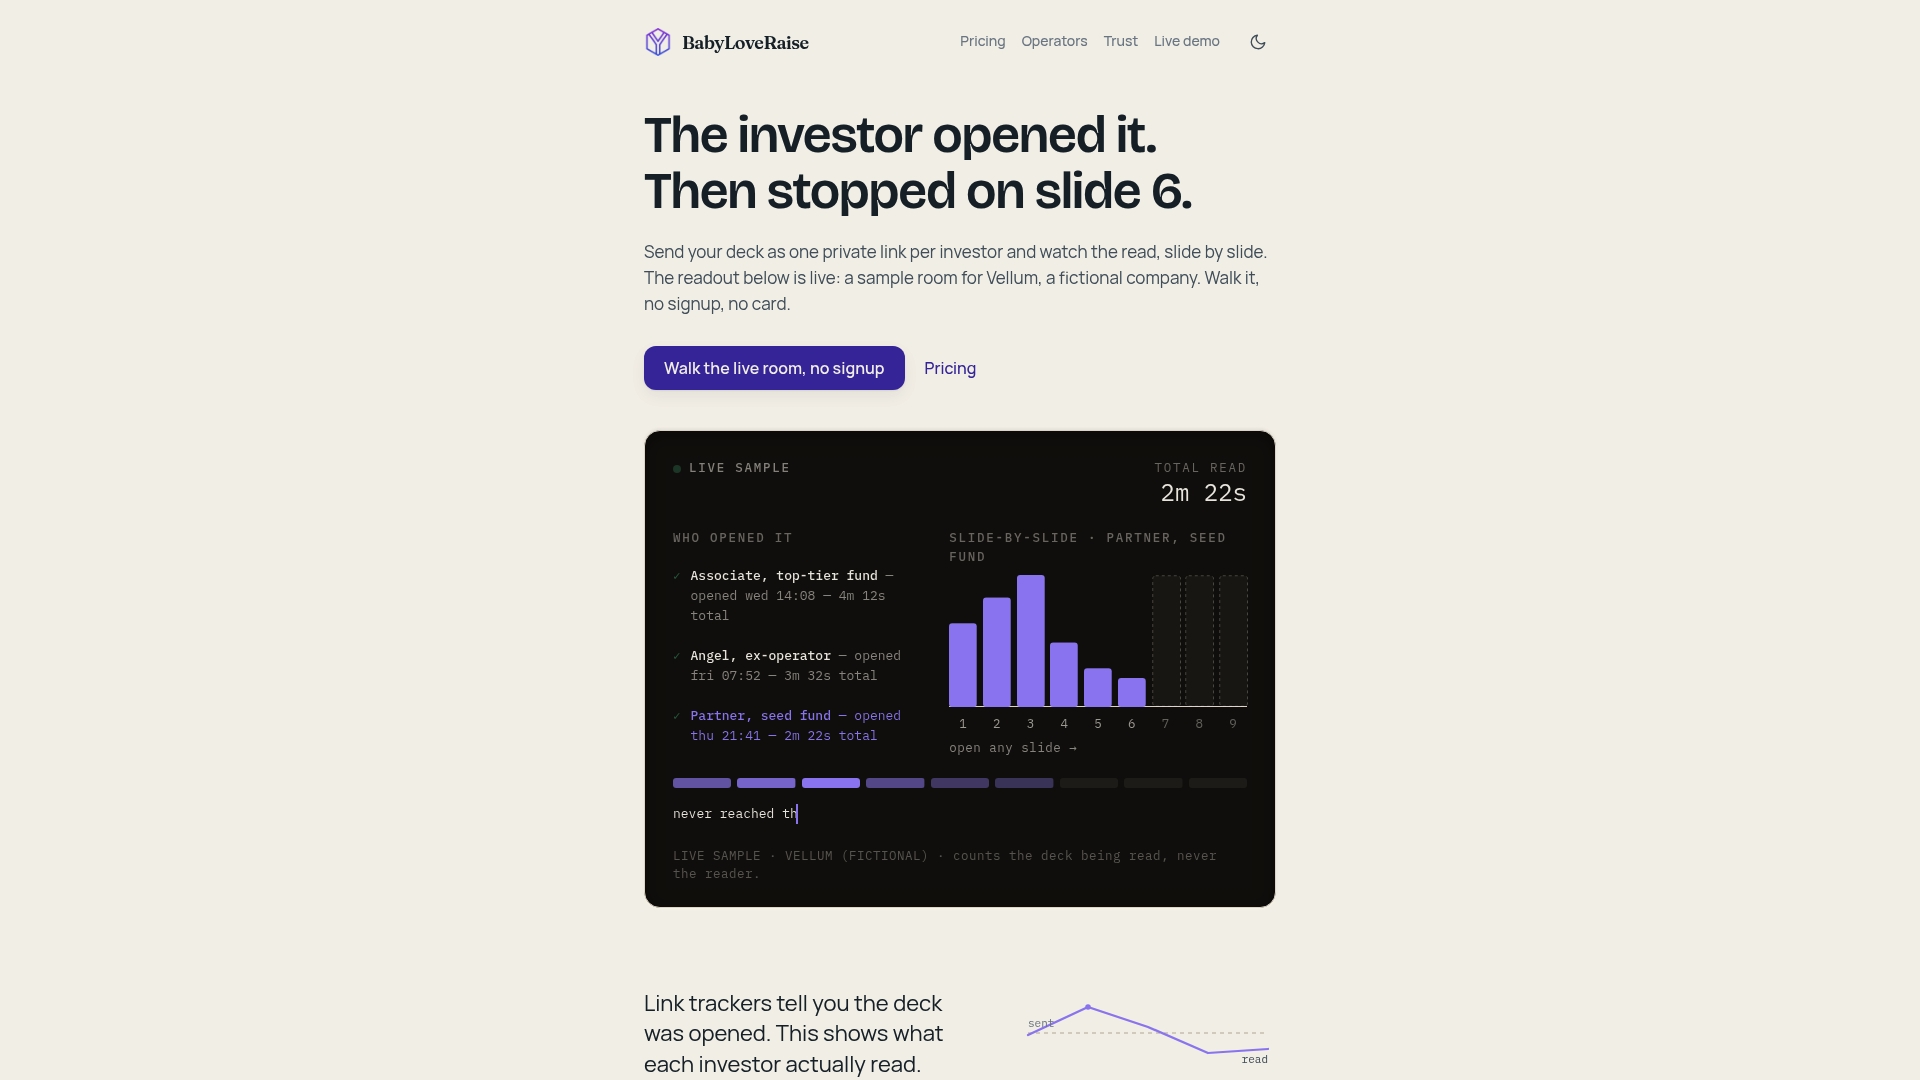
The raise room is $149 per month or $399 per quarter. A draft room and an editorial pass for your deck are also available. See current plans on the pricing page. If you advise several founders, the Operator plans let you run firm-branded rooms across client raises.
FAQ
What is investor update analytics?
It is the measurement of both the business metrics you report to investors and how investors engage with the update itself. The first covers revenue, burn, runway and headcount. The second covers opens, clicks, reading depth and replies. Used together, they tell you how the company is doing and how well you are communicating it.
Can I tell if an investor actually read my update?
Not from an email open alone, since opens show only that a message was noticed or loaded. A tracked link to a hosted page gives stronger evidence: you can see visits, how far someone read and which sections they spent time on. Even then, you see behavior with a document, not their opinion of it.
What metrics should a pre-seed startup include?
Start with the basics: revenue, total expenses, net burn, ending cash, headcount and fundraising status, each with its change from last month, as Right Side Capital outlines. Add a few KPIs specific to your model, such as waitlist growth, activation or early retention.
How often should I send updates and check the data?
Monthly is the common rhythm for sending, with the numbers delivered within days of month-end. For reviewing engagement, check weekly while you are actively raising and monthly otherwise, then look at the trend each quarter.
Is tracking investors’ reading behavior acceptable?
Tracking at the document level, meaning pages and sections viewed, is a common practice. Keep it limited to the update, say plainly that you use a private link, and check with your lawyer before collecting anything beyond that, since state privacy rules differ.
Sources
- Minimum Viable Investor Updates, Right Side Capital
- Stage-based startup metrics that impact valuation, Mercury
- Investor-ready monthly financials, explained, Zinance
- Click Through Open Rate: Improve Email Engagement
- The Founder Metrics Dashboard, Fairview
- 2026 Investor Outreach Benchmark Report for Founders
- Privacy Notice Supplement for California Residents
- How Lenders Assess Startup Repayment Ability in 2026
- 90 Day SEO Reporting Metrics Plan for In House Teams