
Pitch Deck Benchmarks for Pre-Seed and Seed Founders in 2026
Slide counts, scores, traction figures and reading time for pre-seed and seed decks, plus how to judge any benchmark and test your own deck against real readers.
November 9, 2026 · 10 min read

Most published benchmarks agree on one range: a pre-seed deck runs about 10 to 13 slides, a seed deck about 12 to 15, and investors give it only a few minutes. Past that, the numbers diverge. Slide-count data, deck scores and traction thresholds come from different samples, years and definitions. This guide gives you the figures, shows where they come from, and explains how to use them without copying someone else’s deck.
BabyLoveRaiseSee Where Investors Lose InterestBabyLoveRaise tracks first reads and per-slide engagement, helping you spot where investors finish your deck or lose attention.Explore deck trackingTL;DR
- Aim for roughly 10 to 12 slides at pre-seed and 12 to 15 at seed. Several independent datasets put the median between 13 and 14.
- Investors read fast. One summary of deck-viewing data puts the average at about 2 minutes 45 seconds, so every slide has to earn its place.
- Graders weight numbers over polish. SaaStr’s analyzer weights traction 75% and deck quality 25%.
- Check the date, sample size and stage of any benchmark before you use it. Many describe one dataset, not all startups.
- A benchmark tells you what others did. Only reader data tells you where your own deck loses people.
Table of Contents
- What a pitch deck benchmark actually measures
- Slide count benchmarks by stage
- The standard slide list and reading time
- Traction and round-size benchmarks
- How reliable are these benchmarks?
- From benchmark to your own deck
- Perspective
- Track your own deck against the benchmarks
- Where to go next
- FAQ
- Sources
What a pitch deck benchmark actually measures
A benchmark is a comparison point. It usually measures one of three things: structure (slide count, word count, order), quality (a score against a rubric), or business metrics (revenue, users, round size at a given stage).
The scoring tools show the difference. SaaStr’s analyzer produces a Traction Score and a Deck Quality Score, combined 75% and 25% into an investment grade. It also reports that deck quality scores cluster between 55 and 70, and that competitive differentiation, market sizing and team slides are common weak spots. Its advice is to run the analysis before pitching, fix the issues, then run it again.
Other rubrics split the deck differently. VC Boom’s published rubric scores seven dimensions: problem, market, solution, business model, traction, team and the ask. It is stage-aware, so it does not penalize missing revenue at pre-seed but expects real metrics at Series A.
A 2026 clarity benchmark of 2,488 scored decks found the weak spots sit in the business logic, not the story. 67.0% of decks scored below half marks on business model and 57.8% failed on deal structure. Only 17.9% failed on problem definition. If your problem slide is strong, the money slides are where to spend your editing time.

Slide count benchmarks by stage
Slide count is the most-quoted benchmark, and the sources are fairly consistent once you separate medians from advice.
| Source | What it reports | Pre-seed | Seed |
|---|---|---|---|
| InvestorSlides analytics (4,592 decks) | Median slide count | 13 | 14 |
| Sequel study of 17,500 decks | Average 16 slides; recommends 11 to 13 | n/a | n/a |
| StartupUrban | Typical US length | 10 to 12 | 12 to 15 |
| Slideegg | Typical length | 8 to 10 | 10 to 12 |
| Story Pitch Decks (2021, 100 decks) | Average seed deck | n/a | 14.55 |
Read the table as a band, not a target. Real decks cluster at 13 to 14 slides. Advice articles tend to recommend slightly fewer, 10 to 12. Both agree the sweet spot is well under 20.
One useful contrast: a roundup that cites deck-sharing data reports that the average founder sends 38 slides, while the average funded deck uses 19 to 20 and top-performing seed decks use 10 to 14. The same piece says 92% of successful pre-seed decks globally include a dedicated problem slide. Treat that as a secondary report of someone else’s data. The pattern still matches the other sources: shorter and more edited beats longer.

Why the numbers differ
The medians differ because the samples differ. A library of 600 US teardowns reports a median of 16 slides, but its decks span 1994 to 2026 and many are late-stage. A deck built for a Series B is not a model for your pre-seed. Match the stage first, then read the number.
The standard slide list and reading time
A 2026 pre-seed guide recommends 10 to 12 slides an investor can read in under three minutes. Its core ten, in order, are title, problem, solution, why now, market, product, traction, team, business model and the ask, plus at most two appendix slides. A B2B SaaS guide suggests 13 slides and splits out go-to-market, competition and financials. It says a deck over 15 suggests the founder has not made editorial decisions.
The order matters as much as the count. We cover it in detail in our guide to the investor-focused slide order. If you want to keep extra material without bloating the main deck, see how to structure a pitch deck appendix.
Two cautions on the slide list. An analysis of eight real decks found a median of 25 slides, ranging from 13 to 36, and that only 3 of 8 stated an amount asked. The analysis warns against copying old decks’ length or treating their order as a formula. Famous decks worked in their time, with their founders and their traction. They are not templates.
Traction and round-size benchmarks
Deck benchmarks only go so far, because investors judge the numbers on the slides. The figures below come from commentary pieces, so treat them as ranges that vary by investor, sector and year.
- Pre-seed: one 2025 founder note gives rough proof points of $1k to $5k MRR for B2B SaaS, 1k to 5k monthly users for consumer products, and $5k to $10k monthly GMV for marketplaces. Scrappier signals include 3 to 5 signed letters of intent or 500+ waitlist signups.
- Seed: a Q3 2026 traction matrix reports a median US seed round of $3.1 million at a valuation near $24 million, with dilution near 18%. For enterprise SaaS, it puts the seed entry band at roughly $100K to $300K in ARR.
- Higher bars: another 2026 piece says some seed investors want $10,000 to $50,000 in MRR before a serious conversation.
- Early-stage checklists: one fundraising playbook lists 10+ customer interviews and an MVP at pre-seed, and 10+ paying customers and $10K+ MRR at seed.
Notice the spread. A seed bar of $10K MRR in one source is $100K ARR in another. That spread is the lesson: no single figure is the threshold. For context on how rounds, stages and funding types fit together, this overview of startup funding stages explained for founders is a useful backdrop before you pick your target raise.
Our own view on putting numbers in a deck is in what to put in a data-driven pitch deck.
How reliable are these benchmarks?
Before you anchor on a number, run five checks.
- Sample. Who submitted these decks? The Sequel Report analyzed 17,546 decks submitted through one platform between April 2023 and June 2025, from 121 countries, with 96% at pre-seed or seed. Its authors say the findings describe that dataset, not the global startup population.
- Date. A 2021 analysis of 100 decks includes seed decks from 2007 to 2020 and an average round of $1.1 million. That is a different market from today’s.
- Stage. A median across all stages hides the pre-seed answer. Look for numbers split by stage.
- Outcome. Most deck datasets show what founders sent, not what investors decided. The Sequel authors note that decks capture only what founders choose to include, and that outcomes are shaped by timing, execution, networks and luck.
- Weighting. A great deck does not make up for weak numbers. Jason Lemkin of SaaStr explains the 75/25 weighting by saying a great deck does not rescue weak numbers. Good businesses with weak decks are common.
From benchmark to your own deck
Benchmarks answer “what do decks look like?” They cannot answer “what happens when my investors open my deck?” Two founders with identical 13-slide decks can get very different reads. The only way to see yours is to measure it.
Here is a practical loop:
- Set your slide count and structure against the stage bands above.
- Send the deck through one tracked link instead of attaching a file.
- Watch which slides get dwell time and which get skimmed. See our guide to per-slide analytics for pitch decks.
- Find the slide where readers stop. Our guide to slide drop-off analysis walks through what to change.
- Revise, resend to the next batch of investors, and compare.
This matters because of a pattern one summary attributes to viewing data: 82% of investors who reach slide four finish the deck, while 31% bounce within ten seconds. It is a secondary report, so use it as a prompt rather than a rule. It still tells you where to look first: the opening four slides.
Perspective
Benchmarks are the best map founders have, and the worst steering wheel. They tell you the median deck is 13 or 14 slides. They do not tell you that your investors stopped on slide seven.
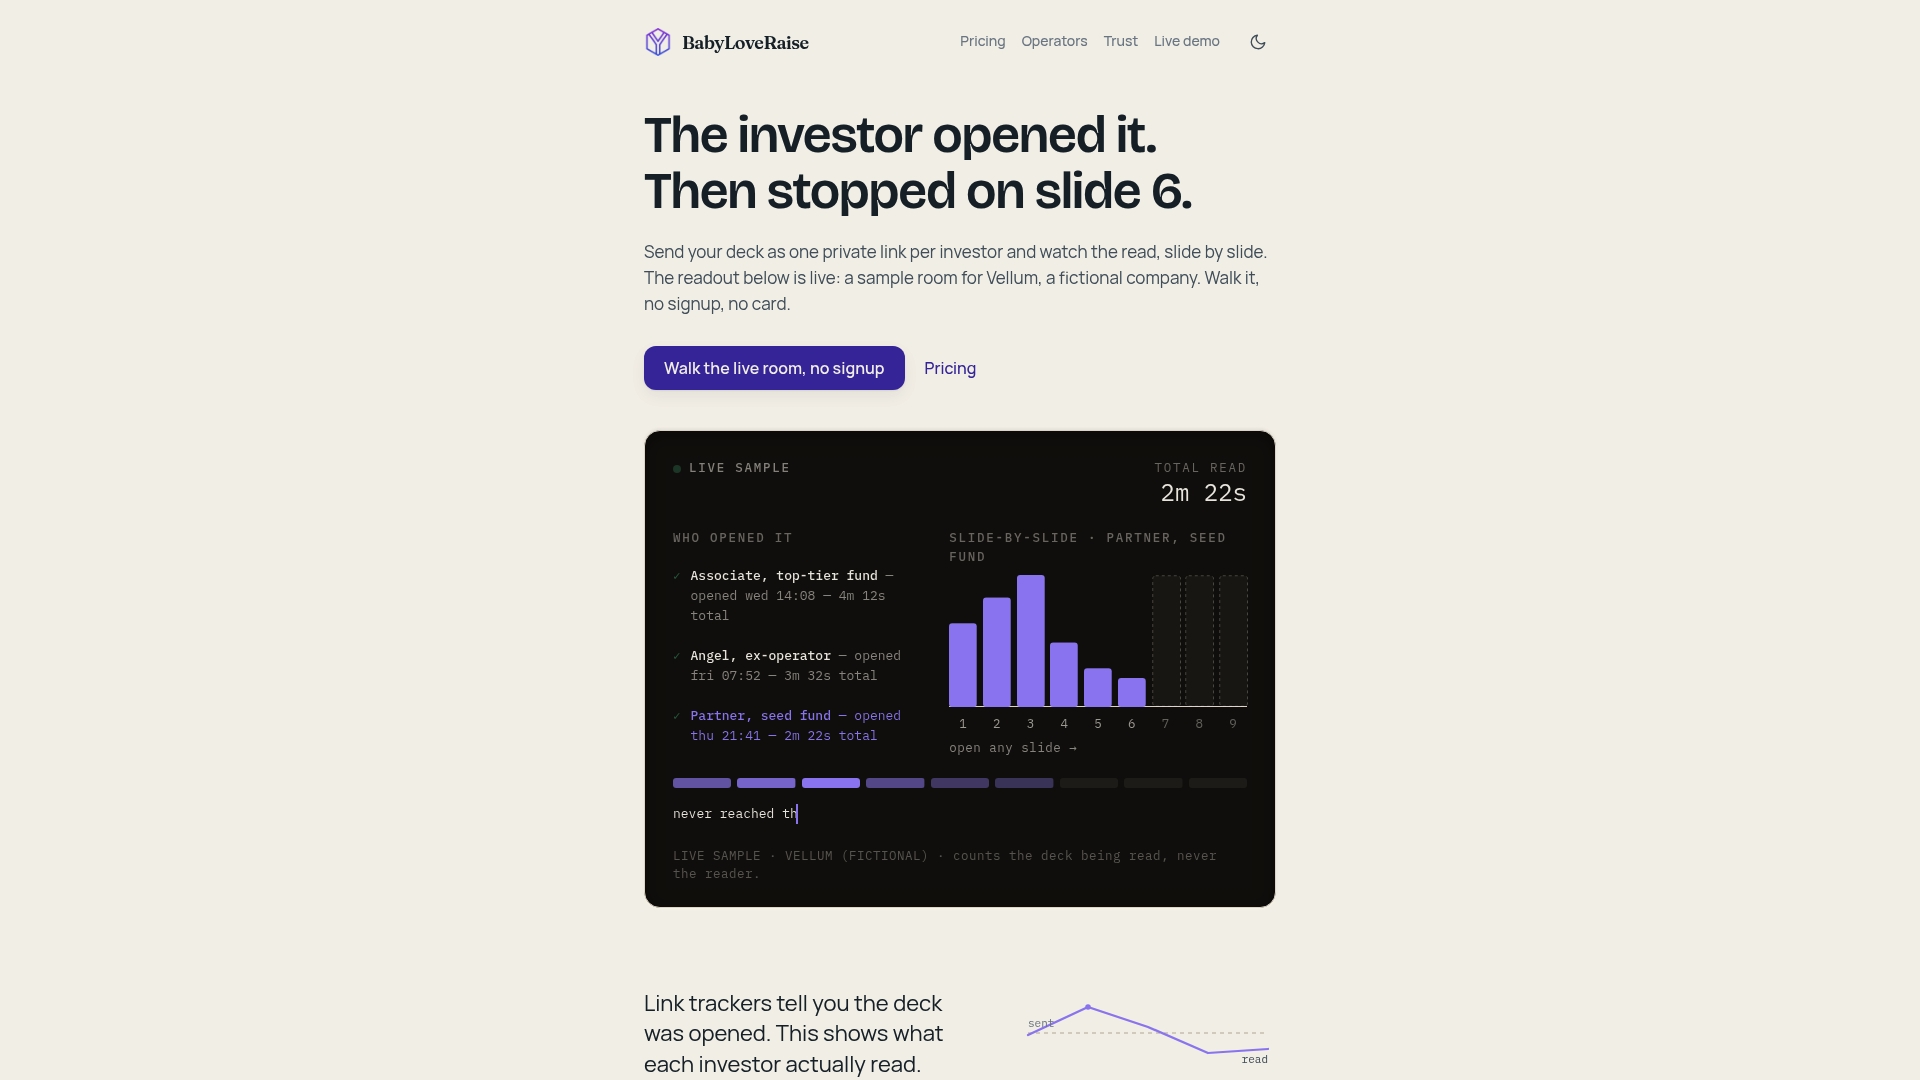
We built BabyLoveRaise around that gap. A solo founder has no cofounder to read the deck cold and say where it dragged. Per-slide dwell is the next best thing. It shows which slides held attention and which got skimmed, so the revision goes to the slides that need it.
It also separates two silences that look the same in an inbox: “never opened it” and “read everything and passed.” The first deserves a nudge. The second deserves a deck edit, or a different investor list. Our tracking reports on the document, not on the person, because we think that is the honest way to do it.
Use the published benchmarks to set your starting point. Then let your own readers tell you what to fix.
Paul
Track your own deck against the benchmarks
If you are actively raising, the raise room gives you one link to send, a notification on first read, and per-slide engagement for each investor who opens it. Share links come in three registers (first send, forwardable and private), and when the raise closes the room converts to a free permanent archive.
The raise room is $149 per month or $399 per quarter. There is also an editorial pass if you want a human review of the deck before you send it. See the raise room plans and editorial pass for details.
Advisors running several client raises can look at the Operator seat, priced at $399 per month per seat or $3990 per year per seat.
Where to go next
Once your slide count and numbers sit in the right band, work on the story. These guides cover the next steps: how to build a pitch deck for investors, pitch deck strategy for winning meetings, and pitch deck examples that win funding.
FAQ
How many slides should a seed pitch deck have?
Most sources land between 12 and 15 slides. InvestorSlides data shows a median of 14 for seed decks, and one large study recommends 11 to 13. If you are over 15, cut or move material to an appendix.
How long do investors spend on a pitch deck?
One 2026 pre-seed guide, citing deck-sharing data, puts the average at about 2 minutes 45 seconds. Treat that as an average, not a promise. Build the deck so the first four slides make the case on their own.
What do investors expect to see for traction at pre-seed?
It varies by sector and investor. One founder note gives examples such as $1k to $5k MRR for B2B SaaS or 3 to 5 signed letters of intent. Some pre-seed investors will back a working prototype and strong customer interviews instead.
Can I trust a benchmark from a blog or a scoring tool?
Use it as a range, not a rule. Check the sample size, the dates and the stage, and see whether the authors describe their own limits. The Sequel Report is a good model: it states that its findings describe its own dataset.
How do I know which slides in my deck need work?
Send it through a tracked link and read the per-slide engagement. Slides where dwell time drops or readers stop are your edit list. Benchmarks give the frame, and your reader data gives the fixes.
Sources
- SaaStr: 4,000 VC pitch decks graded
- VC Boom: pitch deck scoring rubric
- Pitch Deck Clarity Benchmark 2026
- InvestorSlides: startup pitch deck analytics
- Sequel study of 17,500 startup pitch decks
- StartupUrban: US-ready pitch deck structure
- Slideegg: seed vs Series A pitch deck
- Story Pitch Decks: 100 investor pitch decks analyzed
- VentureMage: pre-seed pitch deck example
- StartupFundraising.com: US pitch deck examples
- ValueAddVC: the 10 pre-seed slides
- RunwayTeam: B2B SaaS pitch deck
- Moda: what 8 real decks contain
- VC Cafe: a note to founders in stealth mode
- Steele Consulting Group: Startup Traction Matrix
- Foundra: what 2026 seed investors want
- Scalable Ventures: fundraising playbook
- Sequel Report: The Founder Files
- Whitepage Studio: how many slides in a pitch deck
- Startup funding explained for founders