
Data-Driven Pitch Deck: What to Put In and How to Read It
Build a data-driven pitch deck for pre-seed or seed: which metrics to show, how to chart them, and how to use slide-level engagement data to revise.
November 4, 2026 · 13 min read

A data-driven pitch deck does two jobs. It puts the right numbers in front of investors, and it uses engagement data from the people who read it to decide what to change. Most founders do the first and skip the second. They send a PDF, hear nothing, and cannot tell whether nobody opened it or everybody read it and passed.
This guide covers both halves for pre-seed and seed founders: which metrics earn a slide, how to show them so a skimming investor gets the point, how to read opens and per-slide attention, and what that data can never prove.
BabyLoveRaiseKnow How Investors Read Your DeckBabyLoveRaise tracks first reads and per-slide engagement, helping you distinguish unopened decks from completed reads and target revisions.Explore BabyLoveRaiseTL;DR
- Lead with proof of momentum: traction, a live product or early usage, and metrics defined the same way every time.
- Keep the deck short. Investors give it minutes, not hours, so every chart must carry one clear message.
- Track opens, completion, and time per slide, then change one thing at a time and compare.
- Treat engagement data as a signal about the document, not a verdict on the investor. Small samples prove little.
- Use the data to decide who to follow up with and which slides to rewrite, not to chase individual readers.
Table of Contents
- What “data-driven” means for a pitch deck
- Which metrics belong in a pre-seed or seed deck
- How to structure and visualize the data
- Reading engagement data: what each signal tells you
- What the data cannot prove
- Testing revisions when you only have a handful of investors
- A simple weekly routine
- Put it to work with a raise room
- FAQ
- Sources
What “data-driven” means for a pitch deck
The phrase covers two separate things, and a strong deck needs both.
Data in the deck. Evidence that the problem is real and that people want your answer: revenue, usage, retention, waitlist growth, pilot results, customer conversations. This is the content investors judge.
Data about the deck. Who opened it, whether they reached the last slide, where they slowed down, whether they came back or forwarded it. This is how you improve the document between pitches.
A founder who only does the first is guessing at how the deck lands. A founder who only does the second is polishing a deck with nothing behind it. If you are still shaping the story itself, our guides on pitch deck strategy and the order of slides investors expect cover the structure; here we focus on the numbers.
Which metrics belong in a pre-seed or seed deck
At pre-seed and seed there is rarely a long history to show. Investors are looking for early evidence that something is working, so choose the numbers that show direction.
Show a product and momentum
In a 2019 analysis of pre-seed decks, 92% of companies with successful decks had an alpha, beta, or shipping product, against 68% of those with unsuccessful decks. A more recent study of 17,546 decks found that traction or progress slides gave funded startups a 20.4 percentage point advantage. The pattern is consistent: show that the thing exists and that people are moving toward it.

The same study found funded startups were far more likely to include a website and an email address. It sounds trivial, but a deck that makes it hard to follow up loses people who liked it. Put contact details and a working link on the closing slide.
Pick the metrics that fit your stage
What counts as traction depends on where you are:
| Stage | Metrics that carry weight | What to avoid |
|---|---|---|
| Pre-launch | Waitlist size, week-over-week growth, lead quality, organic versus paid sources | Raw signups with no source breakdown |
| Early product | Weekly active users, activation, retention by cohort, pilot conversions | Vanity totals such as cumulative downloads |
| Early revenue | MRR or ARR, growth rate, gross margin, burn, customer count and concentration | Mixing bookings, billings and revenue in one chart |
For pre-launch startups, one fundraising resource suggests quantifying traction through waitlist size, growth rates, and lead quality, including the split between organic and paid sources. If your product lives in an app store, app store performance tracking can help you measure momentum with real numbers before revenue exists.
Define every metric once, then keep it fixed
The fastest way to lose an investor’s trust is a number that changes meaning between slides. One advisory checklist advises that founders define key metrics such as ARR and gross margin with consistent measurement periods and reconcilable definitions before sending the deck. In practice:
- Say whether growth is month-over-month or year-over-year, and stick to it.
- State what counts as an “active” user and whether trials are included.
- Use the same period end date on every chart.
- Keep a one-page backup with the formulas, so every figure can be reconciled if asked.
The same discipline applies to how your public presence backs up the numbers. If a reader checks your site and sees different claims than your deck, the mismatch registers. A brand audit for SaaS companies can surface inconsistencies in messaging and proof before an investor does.
Evidence of demand before revenue
If you have few customers, conversations still count. Sequoia’s PMF framework points to high hit rates on cold outreach and customers leaning in during demos as signs that a problem resonates. Report these as numbers: how many people you contacted, how many replied, how many took a second call, how many asked to try the product.
Consumer companies get an extra checklist. Andreessen Horowitz suggests that data rooms for them include historical P&L, burn, usage data, and LTV/CAC ratios. You do not need all of it in the deck, but you should be able to produce it quickly. Our piece on what to leave in the appendix explains how to separate the main story from the backup.
How to structure and visualize the data
Investors do not read a deck the way you wrote it. They skim first.
Keep it short
UC San Diego’s startup toolkit recommends 20 pages or fewer for a seed-stage deck, noting that the average investor visit lasts only 3 minutes and 44 seconds. Attention has not grown since. A TechCrunch analysis of 320 decks found investors spent 24% less time on decks in 2022 than in 2021, with failed decks reviewed for an average of 2 minutes and 13 seconds.
The practical conclusion: assume your reader has a couple of minutes, and that the first third of the deck decides whether they keep going. We go deeper on trimming in using timing data to cut deck length.
Open with the summary an investor wants
Sequoia suggests starting with a one-sentence company purpose, a “what changed” shift, and a “fast facts” summary covering team, stage, and traction. That gives a skimmer the whole case on slide two or three, and everything after it becomes proof.
One chart, one message
A chart earns its slide when the title states the conclusion. Compare these:
- Weak title: “Monthly users”
- Strong title: “Weekly active users tripled in four months with no paid acquisition”
A few rules that hold up across stages:
- Use growth lines for trends and simple segmentation charts for customer mix. HubSpot’s guidance recommends growth charts and customer-segmentation pie charts to make key metrics easier to digest.
- Label the axes and the period. Never make an investor guess what the line measures.
- Limit each slide to one idea and one highlighted number.
- Build a visual hierarchy: headline first, chart second, a one-line takeaway third. Investors skim before they read, so headlines must make the investment case on their own.
Clear visuals are a form of storytelling, and visual storytelling tips can help you decide what each slide should emphasize. Treat the deck as the logical reflection of an investment memo, as HubSpot puts it: the problem and proof of traction stay in focus. If you are deciding what belongs in a deck rather than a memo, see deck versus investment memo.
Reading engagement data: what each signal tells you
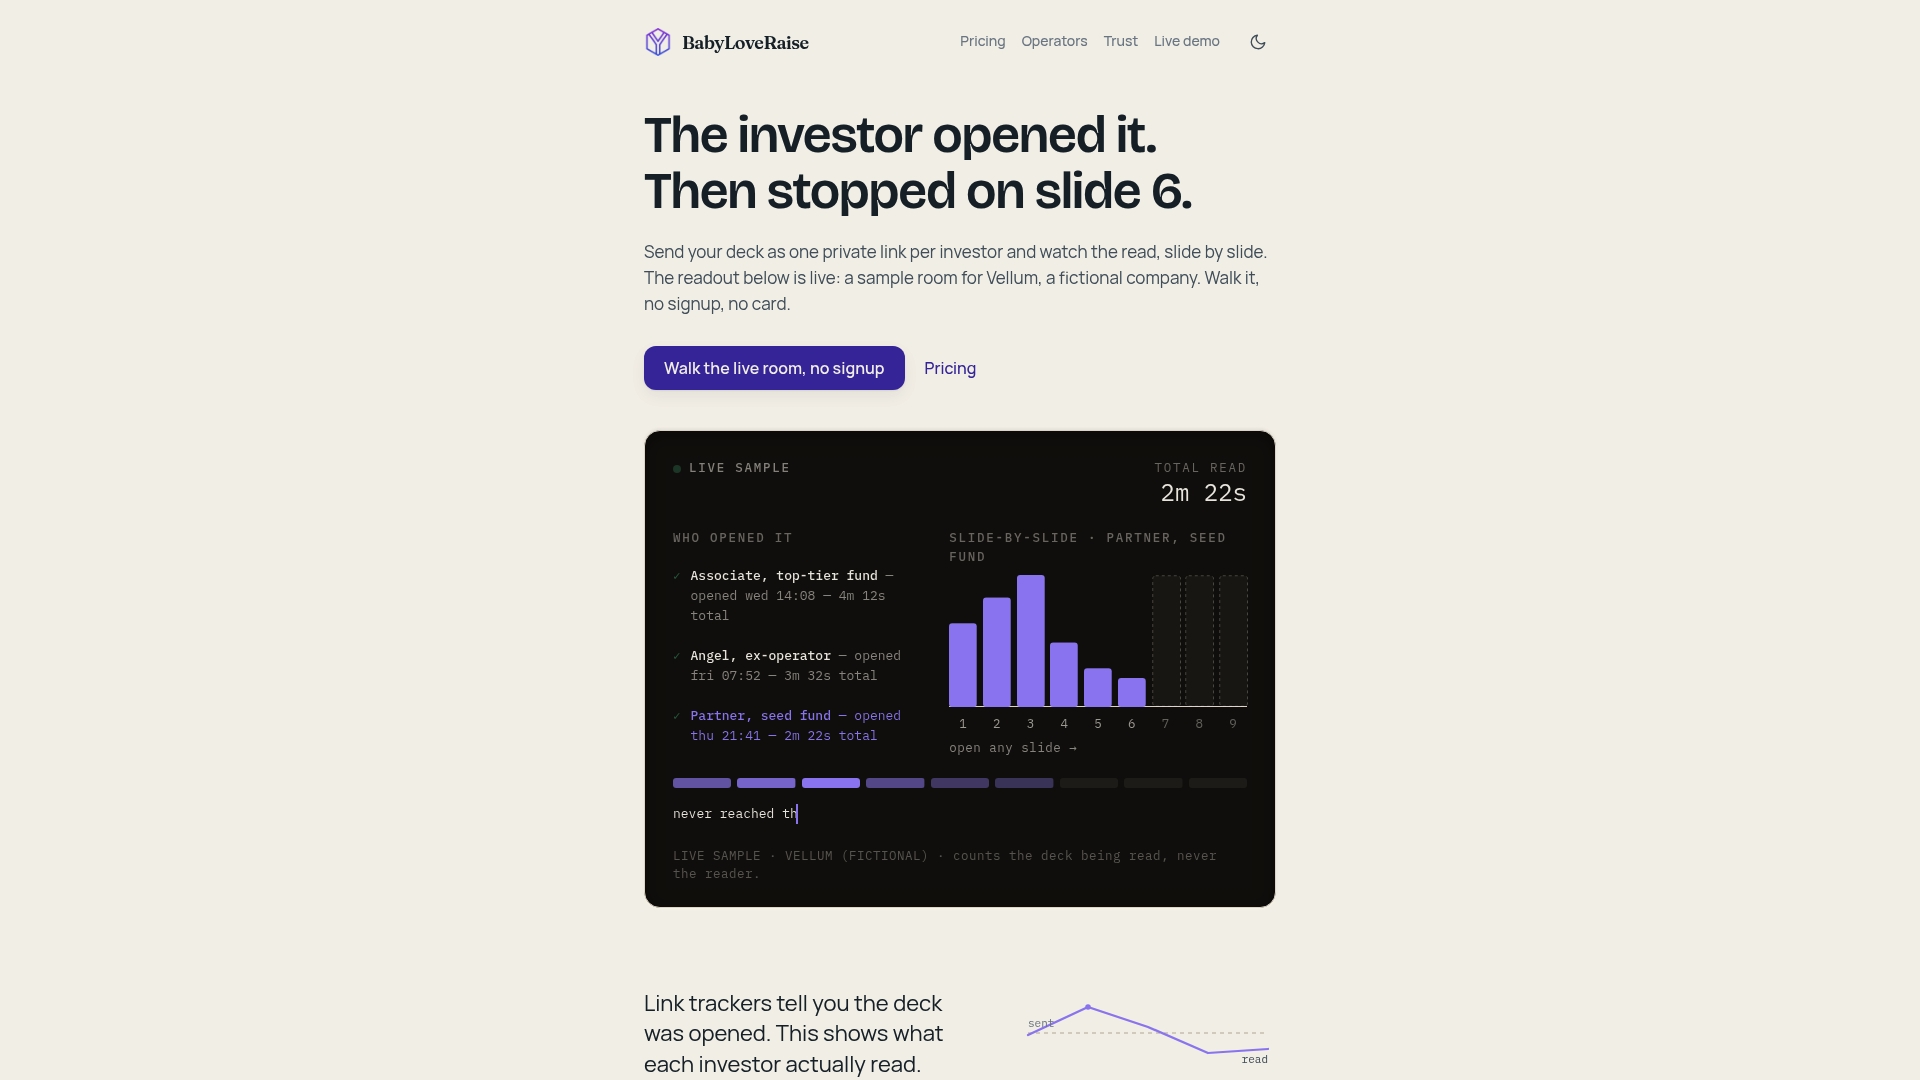
Once the deck is out, the second half of “data-driven” begins. Slide-level analytics can show time spent on product, team, and financial slides, and whether successful decks get repeat visits or are forwarded.
Here is how to interpret the basic signals:
| Signal | What it suggests | What to do |
|---|---|---|
| Never opened | The email, subject line, timing or sender did not land | Resend with a different hook or ask for an intro. Do not revise the deck |
| Opened, left in seconds | The first slides did not earn attention | Rewrite the opening: purpose, “what changed”, fast facts |
| Read to the last slide | Interest, or at least diligence | Follow up promptly while it is fresh |
| Long dwell on one slide | Interest or confusion, and you cannot tell which | Ask a question about that topic in your follow-up |
| Repeat visits | The deck is being considered or discussed | Make sure the data room or backup is ready |
| Forwarded | Someone is sharing it inside their firm | Make the deck self-explanatory without you |
The most useful split is between “never opened” and “read everything and passed.” Without tracking these look the same: silence. With it, they call for opposite responses. One needs a better send, the other needs a better deck or a better fit.
Be careful with “time on slide”
Time spent is ambiguous. In the TechCrunch analysis, investors spent more time on “why now” and “why you” slides in failed decks, while successful decks drew more repeat visits and forwards. The same article reports that investors spent four times as long on product slides in failed decks, likely because they struggled to connect the product to a market need.
So a long dwell is not a compliment. Lingering on a slide may mean the slide is dense, confusing, or raises a doubt. Treat long dwell as a question to answer, not a win to celebrate.
A separate 2019 analysis of pre-seed decks pointed in a related direction on time spent on product slides in successful decks. Studies measured different samples and periods, which is a reminder that no single dwell number is a rule. Read your own pattern across several readers instead.

What the data cannot prove
Engagement data describes how a document was read. It does not say why, and it does not say who decided what.
- It cannot prove interest. A forwarded link might go to a partner who loved it or to an associate who is writing a pass memo.
- It cannot prove disinterest. An investor may read the deck on a phone in two minutes and still call you next week.
- It cannot see the conversation. Intros, references and your own pitch shape outcomes more than any slide.
- It does not justify surveillance. Use the data to improve the document and prioritize follow-ups, not to pressure individuals about their reading habits.
For the same reason, control who receives what. Access settings and different link types let you send a first-contact version, a forwardable version and a private one, and our guide to pitch deck access control walks through the choices.
Testing revisions when you only have a handful of investors
A typical seed raise involves tens of investors, not thousands. That is too few for A/B testing in a statistical sense. The Sequel report’s takeaway is to focus on consistent metrics that differentiate success and avoid over-reliance on small, potentially non-representative samples. Validate the core narrative, such as problem urgency and market opportunity, rather than treating small variations as proof.
A workable approach:
- Send in batches of five to ten. Keep the deck identical within a batch.
- Look for patterns, not outliers. If most readers leave at slide six, that is a signal. If one reader dwells on slide nine, it is an anecdote.
- Change one thing per revision. Rewrite the opening, or restructure the financials, but not both. Otherwise you cannot tell what mattered.
- Label versions. Keep a log of what changed, when, and who received which version. Our guide to deck version control shows a simple system.
- Pair numbers with conversations. After a pass, ask for one line of feedback. A single sentence beats a dozen heat-map readings.
- Stop revising when the pattern stops moving. Endless polishing is a way of avoiding the calls.
For a deeper look at editing the presentation itself, see how to refine your startup presentation.
A simple weekly routine
During an active raise, a 20-minute weekly review is enough:
- Who opened the deck since last week, and who has not?
- Who reached the last slide? Those are your first follow-ups.
- Which slide has the steepest drop-off across readers?
- Which metrics were questioned in calls? Does the deck explain them?
- What is the one change for the next batch?
Write the answers down. After a month you will have a clear record of what the deck did well and where readers left.
Perspective from the team
We built BabyLoveRaise around one observation: a founder raising pre-seed or seed usually has no cofounder to read the deck cold and say where it dragged. Per-slide engagement stands in for that second reader.
We also think the two silences should never look alike. “Never opened it” and “read everything and passed” need different responses, and a plain PDF or Drive link hides the difference. A first-read notification and a per-slide view of attention turn them into two clear states, so follow-ups go to people who actually read and revisions target the slides where attention fell off.
Our approach is to report on the document and never surveil the person. That is why we offer different link types for first sends, forwardable decks and private shares, and why a raise room is priced per raise rather than as a seat you pay for forever. When the round closes, the room becomes a free permanent archive.
Paul
Put it to work with a raise room
If you want first-read alerts and per-slide engagement without stitching tools together, we built the raise room for exactly this. It is $149 per month or $399 per quarter, and it gives you one link to send, a dashboard showing who opened the deck and who finished it, and a free permanent archive once your raise closes.
If you advise several founders, such as a fractional CFO or an advisory firm, the Operator plan runs firm-branded rooms across client raises at $399 per month per seat or $3,990 per year per seat. Editorial help on the deck itself is available as an editorial pass, described on the pricing page. You can also read how we handle tracking on our trust page.
FAQ
How long should a data-driven pitch deck be?
For seed stage, aim for 20 pages or fewer, as UC San Diego’s startup toolkit recommends. Many founders go shorter and move supporting detail into an appendix. If your analytics show readers dropping off before the end, cut the middle first.
Which metrics matter most at pre-seed?
Show evidence that the product exists and that demand is growing. That usually means a working product or prototype, early usage or waitlist growth, customer conversations expressed as numbers, and revenue if you have it. Define each metric clearly and use it consistently throughout the deck.
Can I tell from analytics whether an investor is interested?
Not reliably. Completion, repeat visits and forwards are encouraging signs, but they describe reading behavior, not a decision. Use them to choose whom to follow up with first, then confirm interest in a conversation.
How do I optimize my deck if only a few investors have seen it?
Look for patterns across readers rather than single outliers, and change one thing at a time. With small batches, your goal is to check that the core story lands, not to prove a statistical difference. Pair the data with a line of direct feedback whenever you can.
Sources
- New Data on Pre-Seed Fundraising Reveals Shifting VC Expectations
- The Founder Files, Sequel Report
- Pre-seed and seed pitch-deck checklist, VC Advisory
- The Insider’s Guide to Data Rooms, Andreessen Horowitz
- The Arc PMF Terrifying Questions Framework, Sequoia Capital
- Data-Driven Fundraising: A Guide to Founder Metrics
- Pitch Deck Template, UC San Diego
- Why Most Pitch Decks Fail, HubSpot
- How to Present to Investors, Sequoia Capital
- How To Write An Investor Pitch Deck
- Pitching your product will kill your fundraising, TechCrunch
- Looking at 320 pitch decks, TechCrunch
- SaaS Brand Health Audit
- Market and competitor intelligence for apps
- Visual storytelling tips