
Pitch Deck Heatmap: What It Shows and How to Read It
A pitch deck heatmap shows which slides investors read, skim or skip. Learn how to read slide data, avoid false signals and revise your deck.
October 30, 2026 · 13 min read

A pitch deck heatmap is a picture of attention across your slides. Each slide gets a color or a score based on how long readers stayed on it and how many of them reached it, so you can see where people lingered, where they skimmed and where they stopped. Used well, it tells you which slide to rewrite and which investor to follow up with. Used badly, it turns one skim into a false story about interest.
This guide explains what the data measures, how to read slide order patterns, what it cannot tell you, and how to turn it into a revision list and a follow-up plan.
BabyLoveRaiseSee Where Investors Stay EngagedBabyLoveRaise tracks first reads and per-slide engagement, helping founders identify where attention drops and follow up with readers.Explore the raise roomTL;DR
- A pitch deck heatmap combines per-slide time and reach. It shows where attention concentrated and where it died, not what an investor thinks.
- Slide order analytics compare the sequence you designed with the path people actually took: skipping ahead, backtracking, or leaving early.
- Read patterns across several readers before changing anything. One investor’s two-minute skim is a data point, not a verdict.
- Use the data for two jobs: revising the slides where attention drops, and following up with the people who actually read.
- Track the document, not the person. Keep it honest and disclosed.
Table of Contents
- What a pitch deck heatmap actually measures
- How to read where investors spend time, skim or stop
- What slide order analytics can reveal
- How to avoid overreading the data
- Turning slide data into a revision list
- Turning slide data into follow-up
- A note on privacy and honest tracking
- Our perspective
- Run your raise in a room that reads the heatmap for you
- A simple routine for your next raise
- FAQ
- Sources
What a pitch deck heatmap actually measures
The word “heatmap” comes from website analytics, where it paints hot and cold zones over a page. A deck is different. It is a sequence of discrete slides, so the useful version is a strip or grid with one cell per slide, shaded by a measure of attention.
Two measures do most of the work:
- Dwell time per slide. How long a slide was on screen while the reader was in the deck. Long dwell on a dense financial slide may mean careful reading. Long dwell on a simple slide may mean confusion, or a tab left open.
- Reach per slide. The share of readers who got to that slide at all. A steep drop between slide 6 and slide 7 is the clearest signal a deck can give you.
A good heatmap puts both side by side. A slide with high reach and low dwell was seen and skipped. A slide with low reach never got the chance, which usually means something earlier lost the reader.
What it does not measure is eye movement inside a slide. Despite the name, a deck heatmap generally does not show where on a slide someone looked. It shows which slides drew attention, which is the level at which founders can act. If you want the full mechanics of this, our founder’s guide to per-slide analytics goes slide by slide.
How to read where investors spend time, skim or stop
Start with the shape of the whole strip before looking at any single slide. Most decks fall into a few recognizable shapes.
The cliff
Reach holds near 100% for a few slides, then falls sharply at one point and stays low. Something at the cliff slide, or just before it, gave readers a reason to leave. Common culprits are a market-size slide with numbers that do not reconcile, a wall of text, or a product slide that never explains what the product does.
The slow bleed
Reach falls a little with every slide. This is normal. Most people do not finish most documents. The question is whether the bleed is steeper than it should be early on. If a quarter of readers are gone by slide 3, your opening is not earning the next click.
The hot middle
Dwell is highest on one or two slides, such as team, traction or the ask. That is a healthy sign if those are the slides you want read. It is a warning if the hot slide is the one you designed to be a quick transition, because it suggests the reader was confused rather than engaged.
The flat strip
Every slide gets nearly the same short time. That usually means a skim: the reader paged through to get a sense of the deck and moved on. It tells you little about the deck and a fair amount about how the reader triaged it.
A worked example
Imagine a 14-slide seed deck sent to ten investors. Nine open it. Seven reach slide 6, which is the product slide. Only three reach slide 9, which is traction. Dwell on slide 8, the business model, is high for the readers who saw it.

The reading is not “investors dislike traction.” It is that readers left between slide 6 and slide 9, so the question is what slides 7 and 8 are doing. If slide 8 holds attention for long stretches, it may be too dense, and the reader never recovered. The revision is to simplify slide 8 and move a strong traction number up, then watch the next group of readers. That is a hypothesis, not a conclusion, which brings us to the main risk.
What slide order analytics can reveal
Dwell and reach tell you about slides. Order analytics tell you about the sequence. They answer questions a flat heatmap cannot:
- Did readers jump ahead? If many readers go straight from slide 2 to the team or financials slide, they are looking for something your opening did not give them. Consider surfacing that information earlier.
- Did readers go back? Returning to an earlier slide often means a later slide raised a question. If readers repeatedly return to the problem slide after seeing the solution, the connection between the two may be unclear.
- Where do readers exit? The last slide viewed is as informative as the first. A cluster of exits at the same slide is a cliff by another name.
- Did the ending land? Readers who reach the final slide and the ask are your strongest leads, and the data lets you separate them from people who stopped at slide 5.
This is the empirical side of a question founders usually argue about by opinion: what the right slide order is. Our piece on the investor-focused pitch deck slide order lays out a default sequence. Order analytics let you test your own deck against it instead of trusting anyone’s template, including ours.
How to avoid overreading the data
The most expensive mistake with deck analytics is treating attention as intent. Several things break that link.
Small samples lie. With five readers, one person who got a phone call mid-deck can create a fake cliff. Look for patterns across at least several readers before you change a slide. Treat a single reader’s path as a note, not a trend.
Readers are not equal. A partner who reads on a phone between meetings and an associate who reads at a desk produce very different traces. Neither tells you how interested the fund is.
Forwarding changes the audience. If a deck gets passed along, the later readers may be colleagues with a different job. A reader who gives your financials ten minutes may be the analyst who builds the model, not the partner who decides.
Short is not always bad. An investor who already knows your market may skip the market slide because they do not need it. A short dwell on a slide can mean it was clear.
Long is not always good. Dwell can be confusion, interruption or an idle tab. Pair it with reach and with whether the reader moved on to the next slide.
Silence is ambiguous. Without analytics, a non-reply could mean the deck was never opened or that it was read and passed. Data separates those two states, but it still cannot tell you why someone passed. Only a conversation does that.
A useful rule: let the data tell you where to look, and let people tell you why. When a pattern shows up, ask. A founder who has a real conversation with an investor who passed will learn more than any heatmap offers.

Turning slide data into a revision list
Once you see a pattern across several readers, work through it in a fixed order so you change one thing at a time.
- Find the first big drop in reach. That slide, and the one before it, are your first suspects.
- Read those slides as a stranger. Could someone with no context explain the point in ten seconds? If not, cut words, enlarge the key number, and make the headline state the conclusion.
- Check order before content. If readers jump past a slide, the question may be placement rather than writing.
- Change one slide, then send the new version to the next batch. If you change five things, you will not know which one helped.
- Compare like with like. Judge the new version against readers of the same type, such as cold outreach versus warm introductions.
Visual clarity does a lot of the work here. If your drop slide is cluttered, practical design practices for pitch deck visuals can help you tighten layout and hierarchy before you resend. For a structured way to run these changes, see how to run four pitch deck tests in one sitting, and for a broader view of how to refine a presentation, our guide on refining your startup presentation.
Turning slide data into follow-up
The other use of the data is deciding who to contact and what to say.
| What the data shows | What it likely means | A sensible next step |
|---|---|---|
| Never opened | The email was missed, filtered or ignored | Resend once with a clearer subject line, or try another channel |
| Opened, left in the first few slides | Triaged and set aside, or interrupted | Wait, and do not chase. Consider whether your opening needs work |
| Read to the last slide | Real interest, or thorough diligence | Follow up promptly and reference something specific |
| Returned to the deck more than once | Possibly sharing it or revisiting a question | Offer a call and be ready to answer questions on the revisited slide |
| Long dwell on financials | Checking the numbers | Have your model ready and offer to walk through assumptions |
The table lists likely meanings, not facts. The aim is to prioritize your time. A founder juggling thirty investors cannot give every one the same attention, and a list of who finished the deck is a defensible way to decide whom to write to first.
A good follow-up mentions the substance, not the surveillance. Writing “I saw you read slide 9 at 11:42” feels like being watched. Writing “happy to go deeper on our retention numbers if useful” uses the same insight without making the investor uncomfortable.
A note on privacy and honest tracking
Investors are people receiving a document, and how you track them reflects on you. Keep tracking to what the deck needs: which slides were viewed, for how long, and whether the reader finished.
Public-sector practice offers a useful benchmark. The US Federal Trade Commission’s own privacy assessment of its web analytics describes anonymizing IP addresses and using aggregate data without collecting personally identifiable information. You do not need to match that exactly, but the principle carries over: collect what answers your question and no more.
Two practical habits help. First, tell readers that the link reports on how the document is read, in your email footer or on the room page. Second, do not build profiles that follow someone across other sites or tools. We cover this approach in detail in pitch deck tracking without turning investors into profiles. If you send a deck to investors outside the US, the rules can differ, so check the requirements of the readers’ own countries before you rely on any tracking setup.
Access control also matters. Deciding who can forward, download or re-open your deck shapes the quality of your data, and our guide to pitch deck access control walks through the choices.
Our perspective
We built BabyLoveRaise around a problem we kept seeing: a solo founder sends a deck as a PDF and then lives with two silences that look identical. One investor never opened it. Another read every slide and passed. Both produce no reply, and the founder reacts to both the same way.
A heatmap fixes that first confusion, and that is most of its value. It also stands in for something solo founders often lack: a cofounder who reads the deck cold and says “I lost you at slide 7.” Per-slide dwell is not as good as that person, but it is far better than guessing.
We are cautious about what the data claims, though. We think a heatmap should report on the document, not surveil the reader. That is why we offer three share-link registers: a first-send link, a forwardable link and a private link. The point is that you choose how much a link reveals and how far it can travel, and you know which kind of reader you are looking at.
Our advice is simple. Do not chase a single reader’s data. Look for the slide where several people leave, fix that, and send the next version. Then spend your follow-up time on the people who finished.
— Paul
Run your raise in a room that reads the heatmap for you
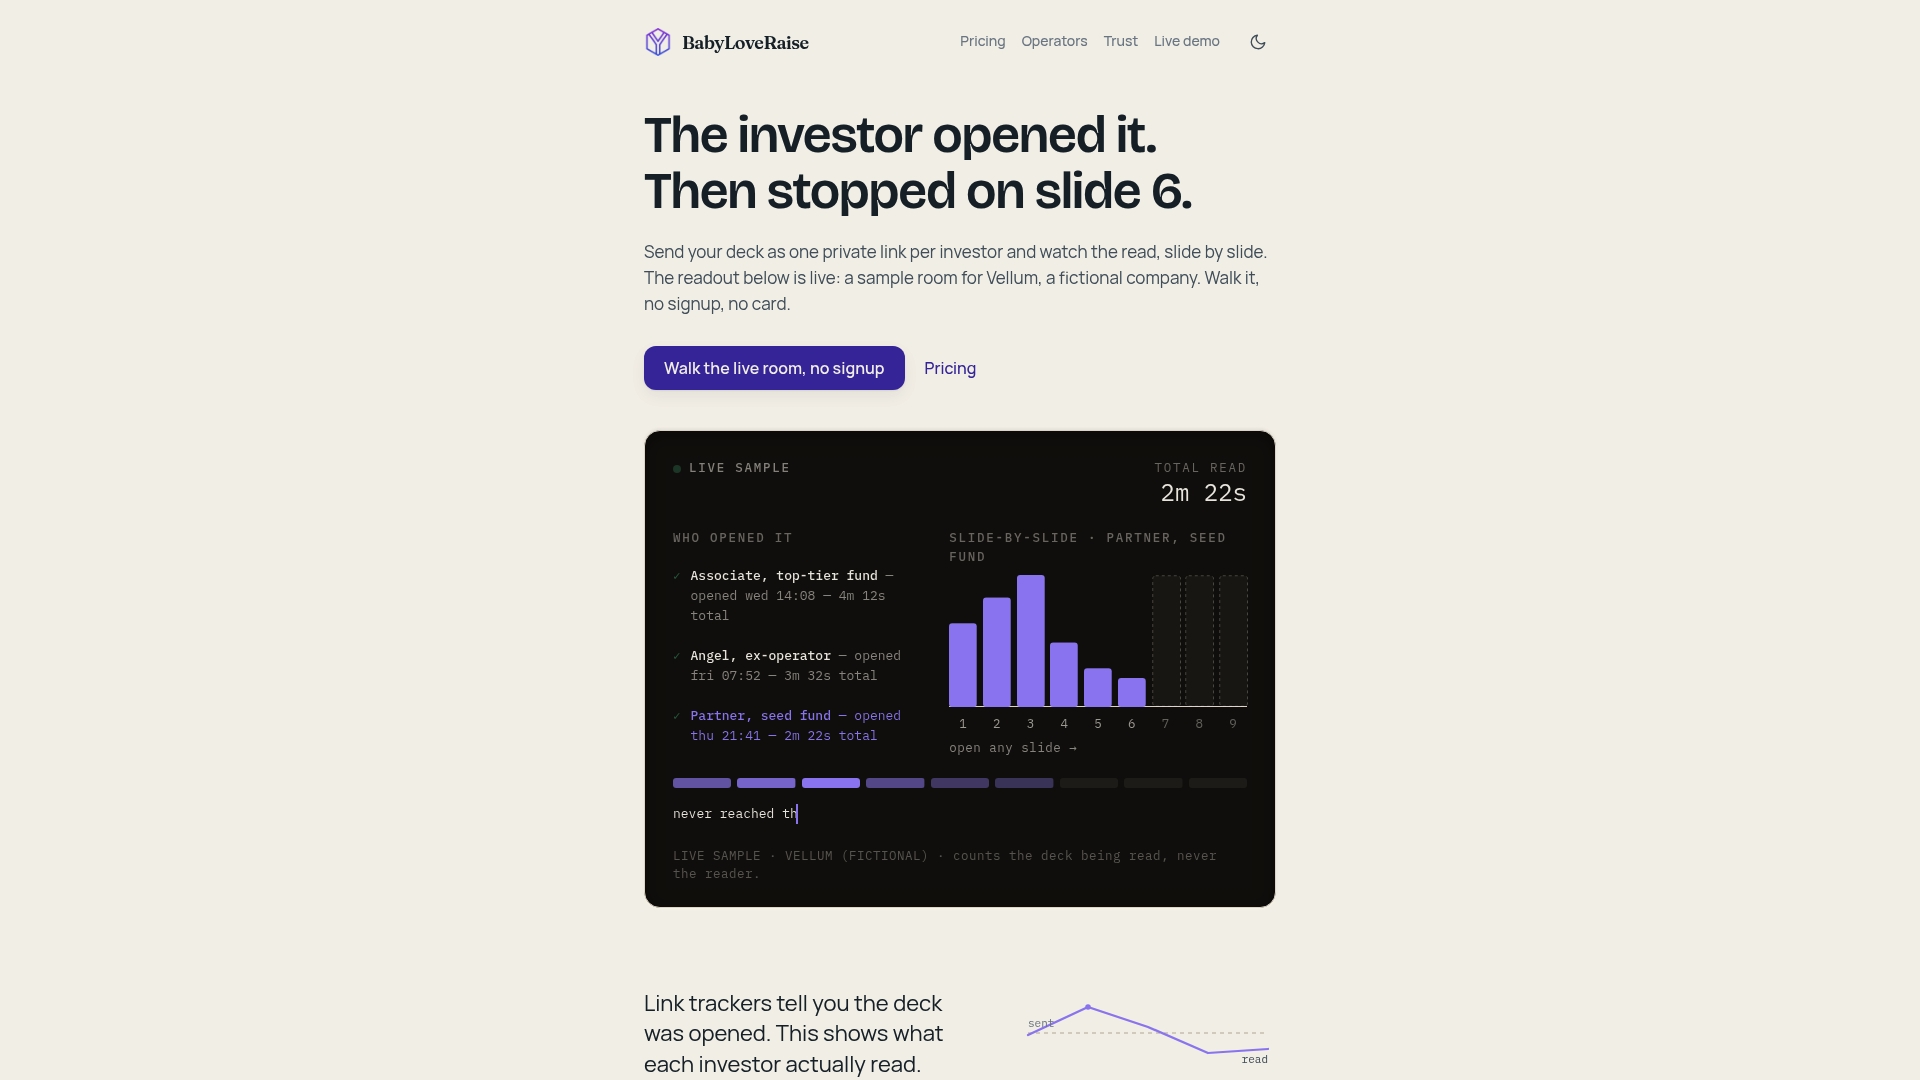
If you are actively raising, the raise room gives you one link per deck, a notification when it is first read, and per-slide engagement showing who opened, who reached the last slide and where attention dropped. It costs $149 per month or $399 per quarter, priced per raise rather than per seat forever, and when the raise closes the room converts to a free permanent archive. Details are on the pricing page. If you advise several founders, the operator plans let you run firm-branded rooms across client raises.
If you want to see how the room handles data before you commit, our trust page explains how we approach it. And if you are still building the deck itself, start with how to build a pitch deck for investors or look at pitch deck examples that win funding.
A simple routine for your next raise
A heatmap earns its keep when you check it on a schedule rather than obsessively.
- Before sending: decide which two or three slides matter most to you, such as traction and the ask. Those are what you will watch.
- After the first batch: once you have several readers, look at the strip as a whole. Note the biggest drop and the hottest slide.
- After each revision: write down what you changed and why, so you can compare the next batch honestly.
- Weekly: sort your target list by who finished the deck, and plan follow-ups from the top.
- After the raise: review which slides held attention across all readers. That is useful material for your next round, and for the narrative you tell in meetings. For the wider picture, see our overview of pitch deck analytics for founders and our pitch deck strategy guide.
Keep the routine short. Ten minutes twice a week is enough. The goal is to make one better decision at a time, not to stare at a dashboard.
FAQ
Does a pitch deck heatmap show where on a slide investors looked?
Generally no. Deck analytics work at the slide level, showing time on each slide and how many readers reached it. That is enough to tell you which slide to fix, even though it does not show eye movement within a slide.
How many readers do I need before the data means anything?
There is no magic number, but a single reader is never enough. Wait until several people have read the deck and look for the same slide where attention drops across them. If the pattern repeats, treat it as worth testing.
Is a short read a sign an investor is not interested?
Not necessarily. The reader may have been interrupted, may know your market already, or may have read on a phone between meetings. Treat a short read as a reason to hold back from chasing, and a full read as a reason to follow up promptly.
What does slide order analytics tell me that dwell time does not?
It shows the path: whether readers jumped ahead, went back, or left at a particular slide. If many readers skip straight to one slide, that information may belong earlier in your deck.
Is it acceptable to track investors who open my deck?
Tracking how a document is read is common practice, but keep it limited to slide views, time and completion, and be open that the link reports engagement. Avoid building profiles of individuals beyond the deck, and check local rules if your readers are outside the US.