
Slide Attention Tracking: What It Measures and How to Use It
Slide attention tracking shows which slides get read and which get skimmed. Learn what the signals mean, where they mislead, and how founders act on them.
October 29, 2026 · 12 min read

Slide attention tracking records how a viewer moves through a deck: whether they opened it, how long each slide stayed on screen, and whether they reached the last slide. For a founder raising money, it replaces guessing with a per-slide picture of where readers stayed and where they left. It is a strong signal about a document. It is not proof that anyone understood it or wants to invest.
This guide covers what the numbers capture, what distorts them, how to read them without fooling yourself, and how to turn them into deck edits and follow-ups.
BabyLoveRaiseSee Where Investors Stay EngagedBabyLoveRaise tracks opens, slide-by-slide engagement, and deck completion in a hosted raise room, helping founders focus follow-ups and revisions.Explore BabyLoveRaiseTL;DR
- Slide attention tracking measures behavior on a document: opens, time per slide, and completion. It does not measure comprehension or intent.
- Time on a slide is an indirect measure. Researchers who study reading times and eye movements describe them as hard to interpret on their own.
- Bots, hidden tabs and idle readers all distort the numbers, so trust patterns across several readers over any single session.
- Use the data for two jobs: revise the slides where attention dropped, and follow up with people who actually read.
- We built BabyLoveRaise around this workflow, with per-slide engagement inside a hosted raise room.
Table of Contents
- What slide attention tracking actually measures
- The signals worth watching
- What distorts the numbers
- How to read the patterns without fooling yourself
- Turning attention data into deck edits
- Turning attention data into follow-ups
- Our perspective
- How BabyLoveRaise handles slide attention
- A checklist before you trust any attention report
- Related reading for your raise
- FAQ
- Sources
What slide attention tracking actually measures
The phrase covers two very different worlds, and it helps to separate them.
The first is the research lab. In a classroom PowerPoint study from Taiwan, researchers used eye-movement indicators such as time in an interest zone, fixation count and fixation duration to stand in for visual attention. That is true attention tracking: a camera follows the eyes and the software records where they land.
The second is the hosted deck. Nobody points a camera at an investor. Instead, the platform records events on the document itself:
- Open events. Someone clicked the link and the deck loaded.
- Slide views. Each time the viewer lands on a slide, the system logs it and notes how long they spent on the previous one.
- Completion. The viewer reached the last slide.
- Session context. Rough device type and location, depending on the tool.
So “attention” in a deck room is a proxy. Dwell time on a slide stands in for attention, the way fixation time stands in for it in a lab. The proxy is useful, but you should hold it loosely. We come back to that below.
Why a pitch deck is a special case
A live presenter watches faces. A solo founder emailing a deck has no faces to watch. There is no cofounder looking over an investor’s shoulder, no hint of a nod or a frown. Per-slide dwell is the closest thing to that missing reaction, and that is why founders search for this topic at all.
The usual alternative, a PDF attachment or a shared drive link, creates two silences that look identical: nobody opened it, or someone read all of it and passed. Those need opposite responses. In the first case you resend or change the subject line. In the second you ask for feedback or move on. Slide-level tracking is what separates them.
The signals worth watching
Not every number deserves your attention. These are the ones that change what a founder does next.
| Signal | What it tells you | What it does not tell you |
|---|---|---|
| First open | The link reached a real person (or a bot) | That they intend to read |
| Completion | They reached the final slide | That they read the slides in between |
| Time on slide | Where the viewer lingered | Whether they lingered from interest or confusion |
| Skipped or skimmed slides | Where momentum died | Why it died |
| Return visits | The deck was reopened, often after a conversation | Whether the second look was positive |
| Forwarding | The deck traveled inside a firm | Who saw it and what they concluded |
The pattern matters more than any single cell. One investor spending four minutes on your traction slide is an anecdote. Five of eight investors spending seconds on it is a finding.
Reading style, not just time
Some tools also look at how a viewer navigates. A person who pages through carefully by keyboard tends to behave differently from one who flicks the scroll wheel past everything. Treat this as a soft hint. Browsers, trackpads and habits vary a lot from person to person, so never build a conclusion on it alone.
What distorts the numbers
Honest analytics come with honest limits. Before you react to a chart, check for these.
Bots and link scanners. Email security tools often open links automatically to check them. That can register as an open that no human made. If a deck was “opened” a few seconds after you hit send, by a viewer who touched nothing, be skeptical.
Hidden tabs and idle readers. A viewer who opens your deck, then leaves to take a call, can appear to have studied slide four for twenty minutes. Better tracking pauses the clock when the tab is hidden or the reader goes idle. Ask whatever tool you use whether it does this. If it does not, long dwell times on a single slide deserve suspicion.
The measurement itself. Academic work is blunt about this. A paper on using reading times and eye movements notes that these are indirect measures of cognitive processes that are difficult to interpret, and suggests triangulating them with other methods such as think-aloud protocols. A founder’s version of triangulation is simple: pair the numbers with a conversation.
Slide content. A dense market-sizing slide takes longer to read than a clean title slide, even for an engaged reader. Compare each slide against what a normal read of that slide should take, not against the average of the whole deck.

How to read the patterns without fooling yourself
Three habits keep you honest.
1. Look for clusters, not individuals
With pre-seed and seed raises, your sample is small. Ten or twenty readers is plenty to see a shared drop-off, and far too few to rank individual slides by decimal points. If most readers stall on one slide, change it. If one reader did something odd, note it and move on.
2. Separate “slow” from “stuck”
Long time on a slide has at least three explanations: the reader found it compelling, the reader found it confusing, or the reader walked away. Only the third is something the tool can sometimes filter out. For the first two, you need a human. Ask a few readers, ideally ones who passed, what they remember from that slide. Their re-telling in their own words tells you whether the slide landed.
3. Never treat completion as interest
An investor can read every slide and still pass. Reaching the last slide means the deck held attention, which is a real accomplishment for a document that competes with a full inbox. It does not mean the investor wants the next meeting. Use completion to decide who to follow up with first, not to forecast who will wire money.
Turning attention data into deck edits
This is where tracking earns its keep. A workable loop looks like this.
- Send to a first batch. Eight to ten investors is enough to see something, and few enough that you can still change the deck for the rest.
- Find the first slide where readers leave. Drop-off is rarely random. It usually clusters at one or two slides.
- Diagnose the slide. Is it text-heavy, buried in jargon, or placed in the wrong spot? Decks that make an investor wait too long for the problem, the product or the traction usually lose people in the middle.
- Change one thing. Shorten the text, reorder, or split the slide. Changing many things at once means you cannot tell what worked.
- Send the revised version to the next batch. Compare how the new readers behave on that slide.
A word on design. Research on slide design draws on multimedia learning principles such as coherence, redundancy and signaling: remove decoration that does not help, avoid repeating on screen what you would say aloud, and use visual cues to point the eye at what matters. In a deck that is read rather than presented, that means one idea per slide, text sized to be read quickly, and no animation for its own sake.
If you want a deeper walkthrough of this loop, our guides on fixing underperforming slides and running four deck tests in one sitting go slide by slide. For the basics of what per-slide data looks like in practice, start with our founder’s guide to per-slide analytics.
Comparing versions fairly
When you test two versions of the deck, send them to similar audiences. Sending version A to early-stage angels and version B to institutional funds tells you about the audiences, not the decks. Keep the batches comparable, change one variable, and combine the engagement numbers with what readers say. Good storytelling techniques that turn data into decisions help when the fix is in the narrative rather than the layout.
Turning attention data into follow-ups
The second job is deciding who to contact and what to say.
- Opened, finished, no reply. This is your warmest silent reader. A short note offering to answer questions fits well.
- Opened, stopped early. Do not push the same deck again. A brief message that leads with the one point your deck makes best on the slide where they stopped is more useful than a generic nudge.
- Never opened. Check the subject line and the send time before assuming disinterest. A resend with a different subject is reasonable.
- Forwarded. If the deck reached new viewers, ask your contact whether the partner wants a call.
One rule of conduct: reference what you learned about the document, not the person. Writing “I noticed you spent three minutes on slide six” reads as surveillance and burns trust. Writing “I wanted to make sure the unit economics were clear” uses the same insight without announcing it. We keep our tracking honest in this sense: it reports on the deck, not on the individual behind it. For more on turning views into action, see our piece on deck analytics follow-ups.
Our perspective
We think most founders either ignore deck analytics or over-read them. Both are mistakes.
The ignorers send a PDF and wait. When nothing comes back, they cannot tell whether the deck failed or the timing did. The over-readers treat a long dwell time as a buying signal and rearrange their week around one investor.

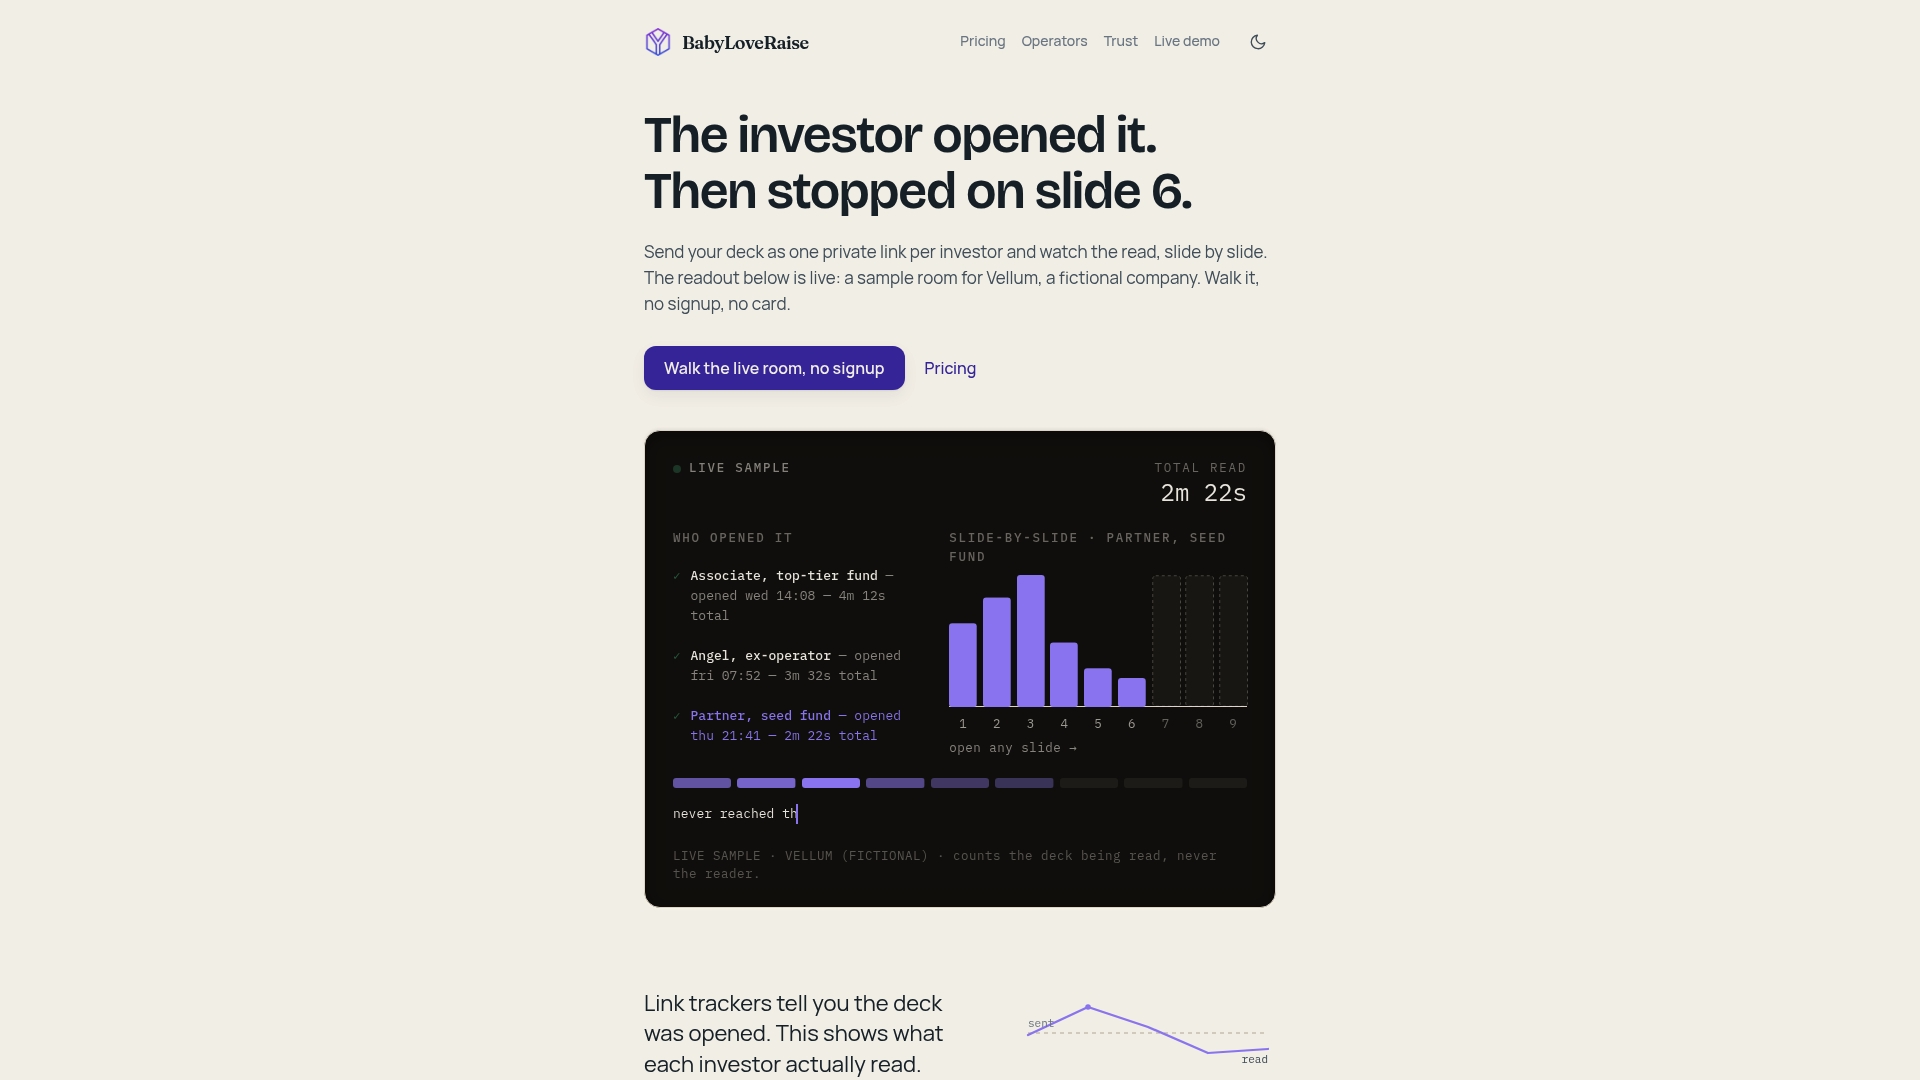
What we have built BabyLoveRaise around is a middle path. A hosted raise room notifies you on first read, records per-slide engagement, and turns “never opened it” and “read everything and passed” into two different states you can act on. We treat per-slide dwell as a stand-in for the cofounder read that a solo founder does not have: a second pair of eyes that tells you where the story sagged. But it is a stand-in, and we say so. The numbers point to where to look. A conversation tells you what you are looking at.
We also price it around the raise itself, not around seats forever, and when the raise closes the room becomes a free permanent archive. A fundraise is a project with an end, and the tool should work that way.
— Paul
How BabyLoveRaise handles slide attention
Our raise room is built for this exact job. You send one room link instead of a PDF. You get notified on first read, see per-slide engagement, and can tell who finished the deck and which slides were skimmed. Share links come in three registers (first send, forwardable and private), and downloads can carry a measured watermark.
The raise room costs $149 per month or $399 per quarter. If you want hands-on help with the story before you send, we also offer an editorial pass, and advisory firms running several client raises can use our Operator seats at $399 per month per seat or $3,990 per year per seat. You can compare everything on our pricing page, and firms can see the Operator plans.
If you are still on a shared link and want to see what you are missing first, our guide to tracking Google Slides views shows what basic tools can and cannot tell you. For how we handle data and privacy, see our trust page.
A checklist before you trust any attention report
Use this before you rewrite a slide or send a nudge.
- Is the sample big enough? Look for the same behavior across several readers.
- Did a human open it? Rule out opens that came seconds after sending.
- Does the tool pause time when the tab is hidden or the reader goes idle?
- Are you comparing a slide against a fair baseline, given how much it contains?
- Do you have a conversation or a reply that confirms the story the numbers suggest?
- Will you change one thing at a time, so you can learn from the result?
If you can answer yes to most of these, the data is doing what it should: narrowing the questions you ask, not answering them for you.
Related reading for your raise
Slide order shapes where attention goes before any tracking begins. Our walkthrough of the investor-focused slide order is a good place to check your structure, and the broader pitch deck strategy guide covers how the deck fits into the meeting you are trying to win. If you want more on turning signals into edits, our guide to improving deck engagement with per-slide signals goes further.
FAQ
What is slide attention tracking?
It is the practice of recording how a viewer engages with each slide of a presentation. In research, this often means eye tracking. In a hosted deck, it means logging opens, time on each slide and whether the viewer reached the end. The result is an indirect picture of attention, not a direct reading of what someone thought.
Is time on a slide a reliable sign of interest?
Only partly. Reading times and eye movements are indirect measures that are hard to interpret, so a long dwell could mean interest, confusion or a reader who stepped away. Look for the same pattern across several readers, then confirm it by asking a few of them.
Can slide attention analysis tell me if an investor will invest?
No. Finishing the deck shows it held attention, but investors read decks and pass all the time. Use completion to prioritize who you follow up with, and let conversations tell you about intent.
How many viewers do I need before changing a slide?
There is no magic number, and small samples are normal at pre-seed and seed. A shared drop-off across most of a first batch of eight to ten readers is a reasonable reason to revise. A single reader’s odd behavior is not.
Is it okay to mention to an investor that I tracked their reading?
It is better not to. Use what you learn to shape your message about the deck, such as clarifying a point you suspect was unclear, rather than telling someone you watched which slides they read.
Sources
- Tracking learners’ visual attention during a multimedia presentation
- Using Reading Times and Eye-Movements to Measure Cognitive Engagement
- “Help us focus, please!”: Designing PowerPoint slides to support attention
- Presentation storytelling techniques that turn data into decisions