
How to Interpret Deck Analytics Before You Follow Up
Learn to read pitch deck analytics: opens, completion, time per slide and re-views, plus benchmarks and what to do next with each signal.
November 5, 2026 · 12 min read

Deck analytics tell you three things: whether a person opened your deck, how far they read, and where their attention stayed or died. Read them as signals about the document, not verdicts on the investor. A short skim, a full read and a second visit each call for a different next move, and this guide shows which move goes with which pattern.
BabyLoveRaiseRead Deck Signals With ClarityBabyLoveRaise tracks first reads and slide engagement, helping founders distinguish an unopened deck from a completed read before following up.Explore BabyLoveRaiseTL;DR
- Separate four signals: opens, completion, time spent and re-views. No single one tells you much alone.
- Public benchmarks put an average view at roughly 2 to 3.5 minutes, so judge a viewer against that range, not against your hopes.
- A re-view is usually the strongest signal. A drop-off that repeats across viewers is a deck problem, not an investor problem.
- Deck activity cannot tell you what an investor is thinking. Investors check your website, your product and your background in parallel.
- Turn each pattern into one action: follow up, wait, or revise the slide where attention fell.
Table of Contents
- What deck analytics actually measure
- Read the four signals in order
- Deck analytics benchmarks: what is normal
- Read the slide-level pattern
- What deck activity cannot tell you
- Turn the signals into follow-ups
- A worked example
- Put it to work in a raise room
- FAQ
- Sources
What deck analytics actually measure
When you send a deck through a tracked link, the tool records events on the document. Most setups capture the same handful of data points:
- Opens: a visit to the link, often with a timestamp and a rough device or location.
- Completion: how many slides were viewed, and whether the last one was reached.
- Total time: the sum of time across all slides in a session.
- Per-slide time (dwell): how long each slide stayed on screen.
- Return visits: a second or third session by the same viewer.
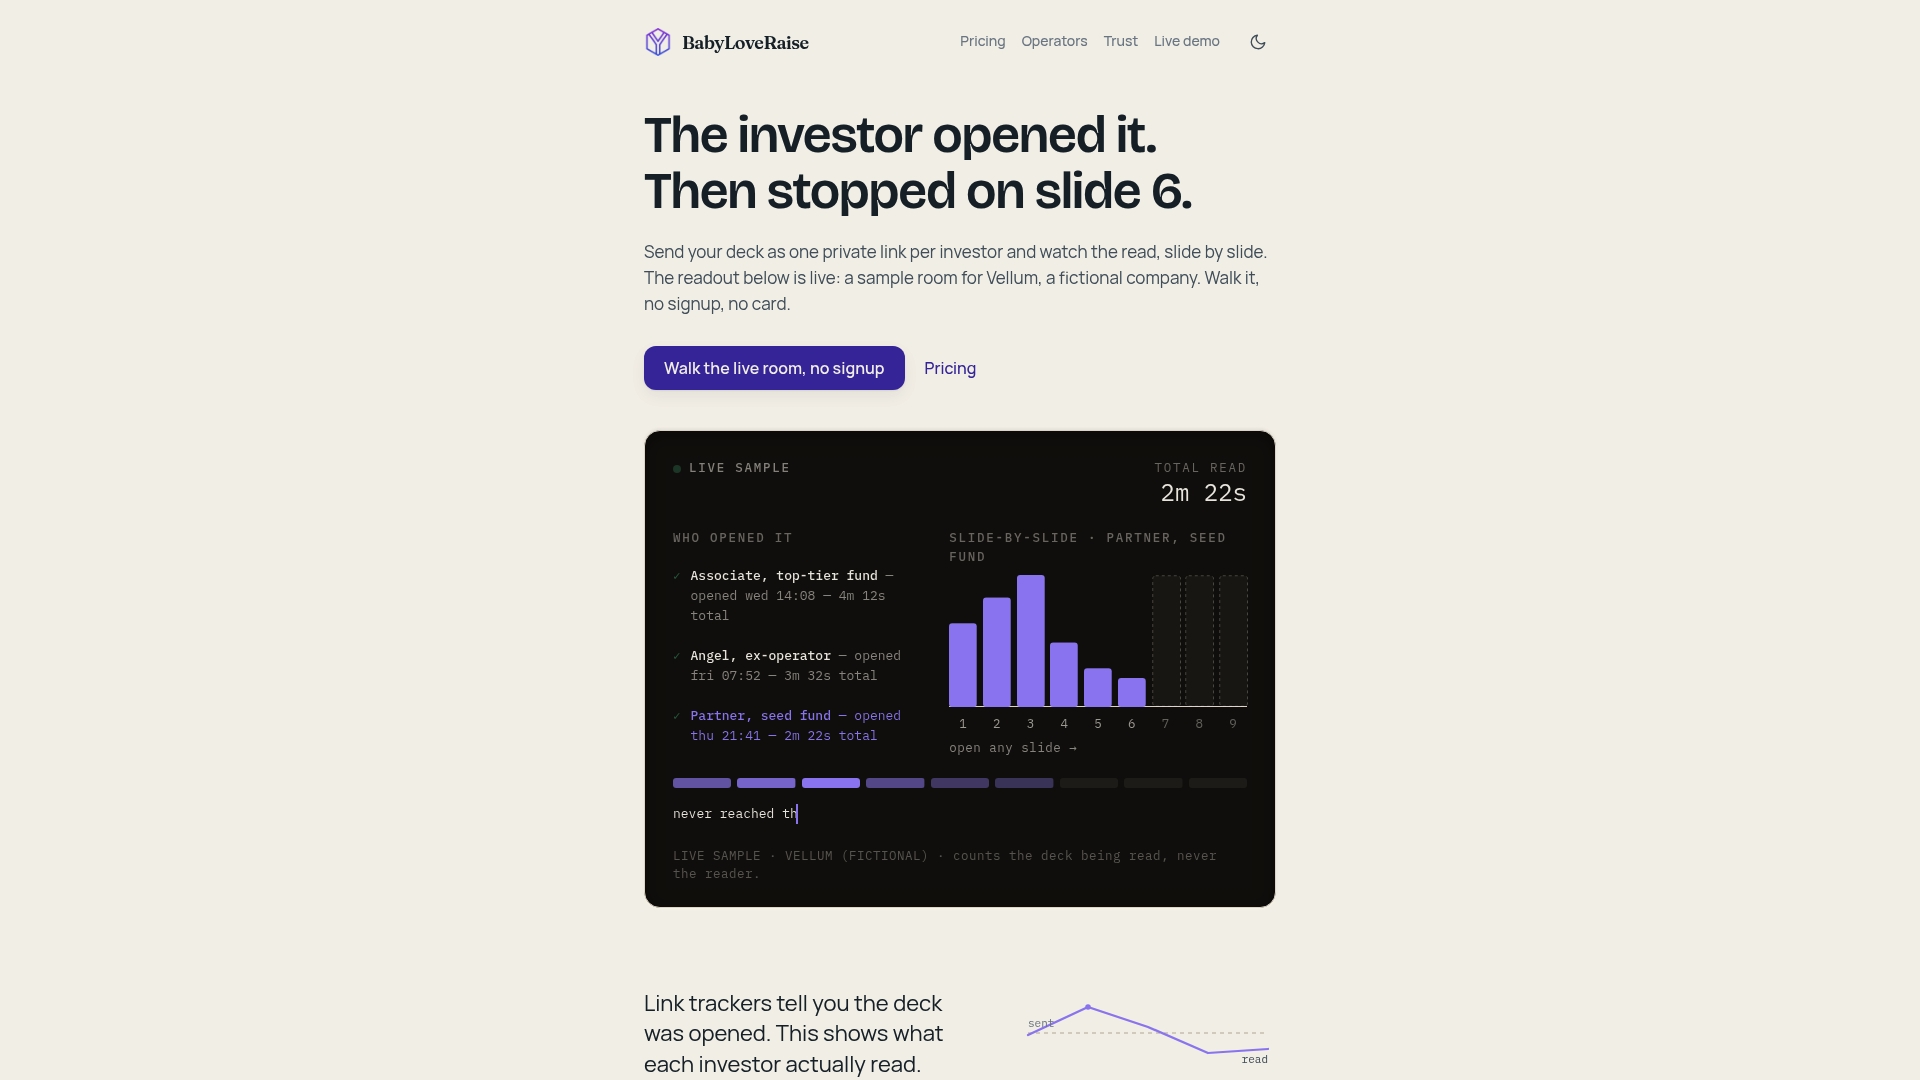
Per-slide dwell is the richest of these, because it replaces the conversation you would have across a table. A solo founder has no cofounder watching an investor’s face. The slide-level data is the closest stand-in. For a deeper walk through that data, see our per-slide analytics guide.
One caveat shapes everything below: the numbers describe how a document was handled. They do not describe a person’s intent. We build around that distinction, so that an honest tracking register reports on the deck and never surveils the individual.
Read the four signals in order
Every pitch deck report can be read in the same sequence. Start with the coarse signal and move to the fine one.
1. Opens: did it land at all?
An open tells you the link was reached. It does not tell you the deck was read. Two situations look identical in a plain email thread: no reply because nobody opened it, and no reply because someone read it and passed. Opens split those apart. If a deck has gone unopened for several days, the problem is delivery or subject line, and the fix is a resend or a different channel, not a new deck.
If you want to act on first opens quickly, pitch deck notifications cover how to be alerted at the first read and what to do in the hours after.
2. Completion: how far did they get?
Completion is the percentage of slides viewed or whether the final slide was reached. A viewer who reaches the ask slide has seen your whole argument. A viewer who stops at slide four has told you something specific about slide four, or about the fit of your company with their thesis.
Be careful with one trap: reaching the last slide quickly is not the same as reading. Someone can flip through 15 slides in 30 seconds. That is why completion has to be paired with time.
3. Time spent: skim or study?
Time separates a skim from a read. One aggregator of fundraising guidance describes a 30 to 60 second view as a polite no, 2 to 4 minutes as real engagement, and more than 5 minutes as strong interest, according to StartupFundraising. Treat those as rules of thumb from a content site, not laws. They are useful because they give you rough bands to sort viewers into.

4. Re-views: the strongest signal
A second session is the pattern most worth acting on. The same guidance names re-views as a strong buying signal. Someone who comes back, especially after a few days, is often forwarding the deck internally, comparing it with other companies, or preparing for a call. Our guide on how to track deck opens and follow up after a second visit goes through timing in detail.
Deck analytics benchmarks: what is normal
Founders searching for benchmarks usually want one number to compare against. There is no single official figure, and published numbers come from different tools, sample sets and years. Here is what is publicly reported:
| Benchmark | Reported figure | Source |
|---|---|---|
| Average view length | 3 minutes 21 seconds | SheetVenture |
| Strong interest | Above 4 minutes | SheetVenture |
| Quick scan, little follow-up intent | Below 2 minutes | SheetVenture |
| Average review time in 2024 | 2 minutes 24 seconds, reported as down 24% since 2021 | Zamora Design |
Notice the spread. One source says the average is above three minutes; another says it was under two and a half in 2024. Both can be true, because they measure different samples and may count sessions differently.
Why benchmarks differ
Three things move the numbers:
- Stage. A seed deck is usually longer than a pre-seed deck, so total time rises with page count. One source cites a recommendation of 19 to 20 pages for seed rounds (Zamora Design). A 12-slide deck will naturally show less total time than a 20-slide one.
- Audience. A partner skimming for a first filter behaves differently from an associate asked to write a memo. The same deck can show a 90-second view and a 12-minute view from two people at one firm.
- Measurement method. Some tools count time only while the tab is active. Others count from open to close. A deck left open in a background tab can inflate the second kind.
So use benchmarks as a sanity check on your own distribution. If most of your viewers fall below two minutes, that matters more than whether you beat an average from a different dataset.
Read the slide-level pattern
After the four signals, look at where attention goes inside the deck. This is where revisions come from.
Front-loaded attention is normal
Investors scan first, and if the scan works they skim and then read, a pattern described by Zamora Design. So expect the first slides to hold the most time. A steep decline after slide two is common. What you want to find is a slide that holds attention against that curve, and a slide that loses it unusually fast.
Common patterns and what to do
| What you see | A reasonable reading | What to do |
|---|---|---|
| Never opened | Delivery or subject line problem | Resend with a shorter note, or try a warm intro |
| Opened, under a minute, stopped early | A quick filter, possibly on fit | Do not chase. Note it and move on |
| Several viewers stop after the same slide | That slide is losing readers | Rework that slide or the one before it |
| Long time on market or traction slides | Those claims are being tested | Prepare a clear answer for questions on them |
| Long time on the team slide | Interest in who you are | Add relevant background and be ready to speak to it |
| Full read, 4+ minutes | Real engagement | Follow up promptly and propose a call |
| Second visit days later | Possible internal sharing or comparison | Send a short, specific follow-up |
The heatmap view is the quickest way to spot these shapes. Our piece on reading a pitch deck heatmap shows what it can and cannot show.
Repeated drop-offs are a deck problem
One viewer leaving at slide six means little. Four viewers leaving at slide six means the deck has a hole there. Guidance on engagement says that when viewers repeatedly drop off after a slide, you should rework that part of the narrative (StartupFundraising). Wait for a pattern across at least a handful of viewers before you rewrite, and change one thing at a time so you can tell what helped.
A slide with long dwell is not automatically good. It may be dense, confusing or full of numbers someone is checking. Ask whether the time reflects interest or friction. Reading a long-dwell slide next to the viewer’s completion and re-view behavior usually settles it.

What deck activity cannot tell you
This is the part founders skip, and it causes the most bad decisions.
- It cannot tell you the decision. A full read can precede a pass. A skim can precede a term sheet if the investor already knew you.
- It cannot see the rest of the diligence. Research on investor behavior notes that investors often check a founder’s website while the deck is open, so the deck is only one part of the qualification process (Plinth Studio). Time on a slide may include time spent on another tab.
- It cannot identify who is reading. A forwarded link may be opened by someone you have never heard of. That is why we offer different link types for first send, forwardable and private sharing.
- It is a small sample. Early rounds involve dozens of viewers, not thousands. Treat percentages with care.
The right stance is that analytics improve your questions. They do not replace asking the investor directly.
Turn the signals into follow-ups
The practical value is timing and relevance. Here is a simple routine.
- Check opens daily during an active send. Sort viewers into never opened, skimmed, read and returned.
- Follow up with readers first. Someone who reached the last slide or came back deserves a short note within a day or two, written about what they likely cared about.
- Reference a topic, not the tracking. Write “happy to go deeper on retention” rather than “I saw you spent 90 seconds on slide 8.” The first sounds helpful; the second sounds like surveillance.
- Leave skimmers alone for now. One light nudge after a reasonable gap is enough, and a different channel can help.
- Revise between waves. If you plan to contact investors in batches, fix the weakest slide before the next batch goes out.
For message timing and wording, our investor follow-up strategy for seed founders covers the cadence, and meeting prep from deck reads shows how to use slide-level attention to anticipate questions.
Which metrics deserve a place on your dashboard
You do not need twenty charts. For a raise, a short list is enough: first-open time, completion, total time, per-slide dwell and returns. Sales teams track a wider set in other contexts, and a good overview of engagement analytics to track shows how the same logic of opens, time and return visits carries across kinds of selling. A fundraise is simply a sales process with unusually few buyers, so each signal carries more weight.
If you want the longer view of how these pieces fit together, our guides on pitch deck engagement metrics and pitch deck analytics for founders extend each point.
A worked example
Imagine you send a seed deck to 25 investors over a week. This is a made-up illustration, not data.
- 6 never open it.
- 10 open and leave within a minute.
- 6 read for two to four minutes.
- 3 read past four minutes, and 2 of those return on day three.
Your plan: resend to the 6 unopened with a new subject line. Leave the 10 skimmers for now. Send specific follow-ups to the 6 readers. Reach out first to the 2 returners, and prepare for questions on the slides where they spent the longest. Then look at the 10 skimmers: if 7 of them stopped on the same slide, rewrite it before the next batch.
Notice what the example does not do. It does not assume the 3 long readers will invest, and it does not write off the skimmers forever. It just allocates effort to the likeliest conversations.
Our view on reading deck data
Most founders live with two silences that look identical: nobody opened the deck, and somebody read all of it and passed. We built BabyLoveRaise to turn those into two different states, because the follow-up for each is completely different.
We also think the useful unit is the raise, not the file. A fundraise has a start, a middle and an end, and the analytics should be organized around that arc: first-read moments, which investors finished the deck, and which slides lost people. That is why we price per raise rather than per seat forever, and why the room becomes a free permanent archive when the round closes.
And we hold a line on tone. The data should describe the document. Our approach is to report on how the deck was read, never to profile the person reading it.
Paul
Put it to work in a raise room
If you are actively raising pre-seed or seed, a hosted room lets you do all of the above from one link: first-read notifications, per-slide engagement and a view of which investors finished the deck. The raise room is $149 per month or $399 per quarter. Fractional CFOs and advisory firms running several client raises can look at the Operator seat, at $399 per month per seat or $3990 per year per seat. If you want a human read before you send, we also offer an editorial pass on the deck.
See the current plans on our pricing page, or the Operator plans for firms.
FAQ
How long should an investor spend on my deck?
Published figures vary. One source reports an average view of 3 minutes 21 seconds, with more than 4 minutes signaling strong interest (SheetVenture). Another reports 2 minutes 24 seconds in 2024 (Zamora Design). Use the range as a guide and compare viewers against your own distribution.
What does it mean if an investor opens my deck several times?
Usually it signals genuine interest, and returning visits are often described as a strong buying signal. The viewer may be forwarding the deck, comparing it with others or preparing for a conversation. Send a short, specific follow-up and avoid mentioning the tracking.
Should I rewrite my deck if people stop at one slide?
Only when the pattern repeats across several viewers. One early exit can be about fit, not content. If many people stop at or just after the same slide, rework that slide or the narrative leading into it, then watch the next batch.
Can deck analytics predict whether an investor will invest?
No. They show how a document was read, not what the reader decided. Investors also run checks outside the deck, such as looking at your website, so treat the data as a prompt for better follow-up rather than a forecast.
Sources
- How to Measure Investor Engagement and Close Your Round, StartupFundraising
- 6 Pitch Deck Metrics Investors Track, SheetVenture
- The 10 20 30 Rule for Pitch Decks and When It Fails, Zamora Design
- Startup Website Design: What Investors Check Before the Deck, Plinth Studio
- Sales Engagement Analytics: What to Track and Why, TrailerCast